Know your true profitability in real-time.
Stop guessing where your money goes. Finsi aggregates costs from ads, shipping, COGS, and subscriptions to give you a real-time P&L that updates daily-not monthly.
Real-Time P&L
See your profit and loss statement update daily with data from Shopify, ad platforms, and subscription providers. No more waiting for month-end reports.
Unit Economics
Track CAC, LTV, contribution margin, and payback period at the cohort level. Understand the true economics of every customer you acquire.
Revenue Breakdown
See revenue split by initial orders, recurring subscriptions, e-commerce, and one-time purchases. Identify which revenue streams drive profitability.
Cost Attribution
Automatically attribute costs from Meta Ads, Google Ads, shipping, COGS, and platform fees to understand true margins per channel.
Period Comparisons
Compare any time period against previous periods or custom baselines. Instantly spot trends and anomalies in your financial performance.
Margin Alerts
Get notified when margins drop below thresholds or costs spike unexpectedly. Never be surprised by a bad month again.
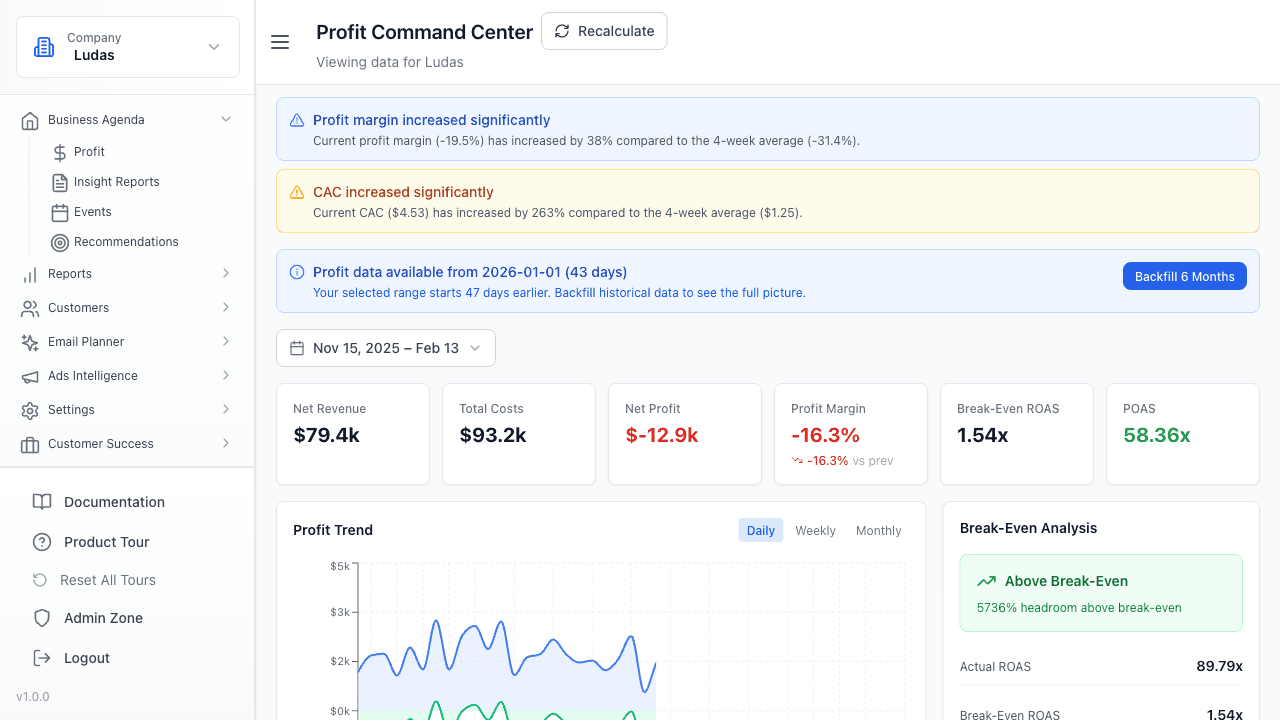
Your complete financial picture, updated daily.
Finsi pulls data from Shopify, your subscription platform, ad accounts, and shipping providers to build a full P&L. See revenue, costs, and margins broken down by channel, product, and customer type-all updating in real-time.
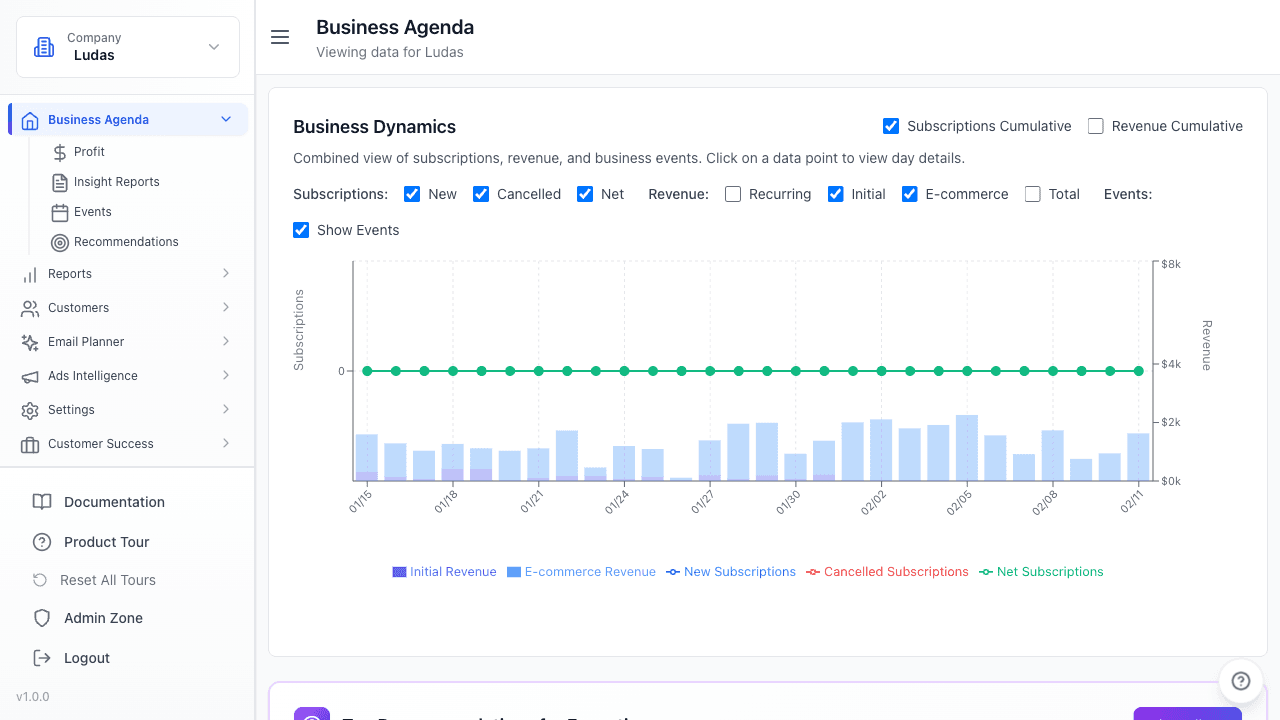
Business Dynamics at a glance.
Track subscriptions, revenue, and business events on a single interactive chart. See new vs. cancelled subscriptions, recurring vs. initial revenue, and overlay key business events to understand what drives your numbers.
Frequently Asked Questions
1. How is the real-time P&L generated?
Finsi connects to your Shopify store, ad platforms (Meta, Google), subscription providers (Recharge, Skio, Smartrr), and shipping carriers to pull revenue and cost data automatically. The P&L updates daily by reconciling orders, refunds, ad spend, COGS, shipping costs, and platform fees-so you always have an accurate financial picture without manual data entry or spreadsheets.
2. What unit economics does Finsi track?
Finsi tracks customer acquisition cost (CAC), lifetime value (LTV), LTV-to-CAC ratio, contribution margin, payback period, and average order value (AOV) at the cohort level. You can break these metrics down by acquisition channel, product, and time period to understand which customers and channels are truly profitable.
3. How does cost attribution work across channels?
Finsi automatically pulls spend data from Meta Ads, Google Ads, and other connected platforms, then attributes costs to specific orders and customers. Shipping costs are matched to individual orders via carrier integrations, and COGS can be set per product or imported from your existing systems. This gives you true per-order and per-customer margins.
4. Which revenue channels are supported?
Finsi supports revenue from Shopify e-commerce orders, subscription platforms (Recharge, Skio, Smartrr, Loop), and one-time purchases. Revenue is automatically categorized into initial orders, recurring subscriptions, and one-time sales so you can see which revenue streams drive profitability and how the mix changes over time.
5. Does Finsi detect financial anomalies automatically?
Yes. Finsi monitors your margins, costs, and revenue trends continuously and alerts you when something deviates from normal patterns-such as a sudden spike in shipping costs, a drop in contribution margin, or an unexpected change in ad spend efficiency. You can set custom thresholds for margin alerts so you are never caught off guard by a bad month.
6. What is the best ecommerce analytics tool in 2026?
The best ecommerce analytics tool depends on what you need it to do. For attribution dashboards, Triple Whale and Northbeam lead. For affordable cohort and LTV snapshots, Lifetimely or Peel Insights are strong entry points. For a full-stack platform that unifies attribution, retention, profit, and AI-driven recommendations in one product — and actually executes on them — Finsi is the strongest option for $1M-$50M DTC and subscription brands. The "best" tool is the one that matches your team's biggest unsolved problem, not the one with the most features.
7. What is the best ecommerce profit analysis software for 2026?
For profit analysis specifically, you need three capabilities: real-time P&L across revenue and cost sources, cohort-level unit economics (CAC, LTV, contribution margin, payback period), and the ability to attribute costs to specific channels and customer segments. Finsi covers all three natively, pulling data from Shopify, Meta and Google Ads, subscription platforms, shipping carriers, and COGS sources. Most competitors stop at revenue dashboards; Finsi gives you the full profit picture and tells you which channels and cohorts are actually making money.
8. How is Finsi different from Triple Whale, Northbeam, and Polar Analytics?
Triple Whale, Northbeam, and Polar Analytics are dashboards-first analytics platforms — they show you what happened. Finsi is execution-first: it covers the same analytics, then adds an AI recommendations engine that ranks growth actions, an Ads Autopilot that actively manages Meta and Google campaigns, predictive churn modeling, AI creative generation, and email intelligence. The closest comparison is "Finsi is to ecommerce what a fractional CMO is to a leadership team — strategy plus execution, not just reporting."
9. What is the best profit tracking tool for multichannel ecommerce?
For multichannel ecommerce profit tracking, look for a tool that handles Shopify plus subscription platforms plus paid ad channels plus shipping and COGS in one P&L, with the ability to slice by channel, product, and cohort. Finsi handles all of these out of the box, including subscription revenue from Recharge, Skio, Loop, and Bold; ad spend from Meta and Google; shipping from major carriers; and configurable COGS. The result is a daily-updating P&L that shows true contribution margin per channel, not just gross revenue.
Stop Guessing Your Profitability
Join brands that use Finsi to track real-time profitability across their entire operation. Get a daily P&L without spreadsheets or manual data pulls.