The Profit Paradox: Why ROAS is a Trap and Retention is the Only Way Out

The ROAS Addiction
For a decade, DTC and SaaS have run on one number: ROAS. Put $1 into Meta or Google, get $3 back, scale until something breaks. That era of arbitrage marketing minted unicorns, and it also trained a generation of operators to optimize for Day 1 profitability.
The math has changed. Customer acquisition costs are up 222% over the last five years. iOS 14+ destroyed the attribution that made ROAS legible in the first place, and brands now overspend on customers who churn in 30 days because the platforms can't tell them apart from the ones who stick around. Despite all of this, 44% of businesses still prioritize acquisition over retention. They're running on a treadmill that gets faster and steeper every quarter.
This piece walks through why a ROAS-first model is structurally fragile, what an LTV-first model looks like in practice, and how to actually calculate and act on customer value without lying to yourself.
The Profit Squeeze
Most companies running on first-purchase profitability are far more fragile than they think. Take a healthy-looking business:
- AOV: $100
- Gross margin: 60% ($60)
- CAC: $30
- Net profit per customer: $30
30% net margin on the first order. Looks great. Now apply two realistic shocks at once: CAC up 10% (new CAC: $33) and margin down 10% (new margin: $54).
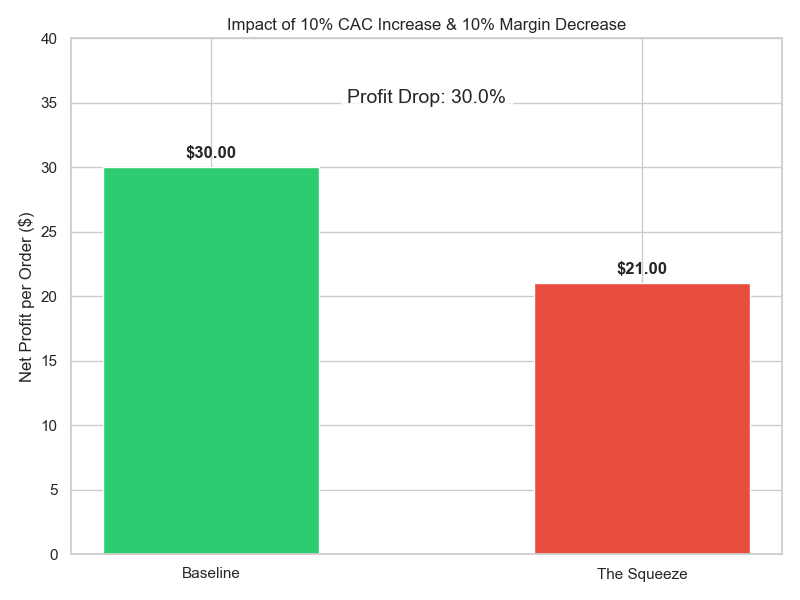
Profit goes from $30 to $21. A 10% movement in costs took out 30% of profit. That's the entire fragility of the transactional model in one example. Operating leverage works both ways, and when your only profit comes from acquiring a new buyer every time, small headwinds in ad costs or COGS wipe out net income.
Two Companies, Same Product
Two hypothetical brands selling the same item. Company A optimizes for Day 1 ROAS: low CAC ($30), high day-one profit, retention treated as an afterthought (one purchase a year). Company B optimizes for LTV: willing to pay $45 to acquire a best-fit subscriber, retention is the core metric, customers buy on a recurring cadence.
Month 1, Company A wins. They banked $20 per customer; Company B made $5. Roll the same comparison forward 12 months and the picture inverts:
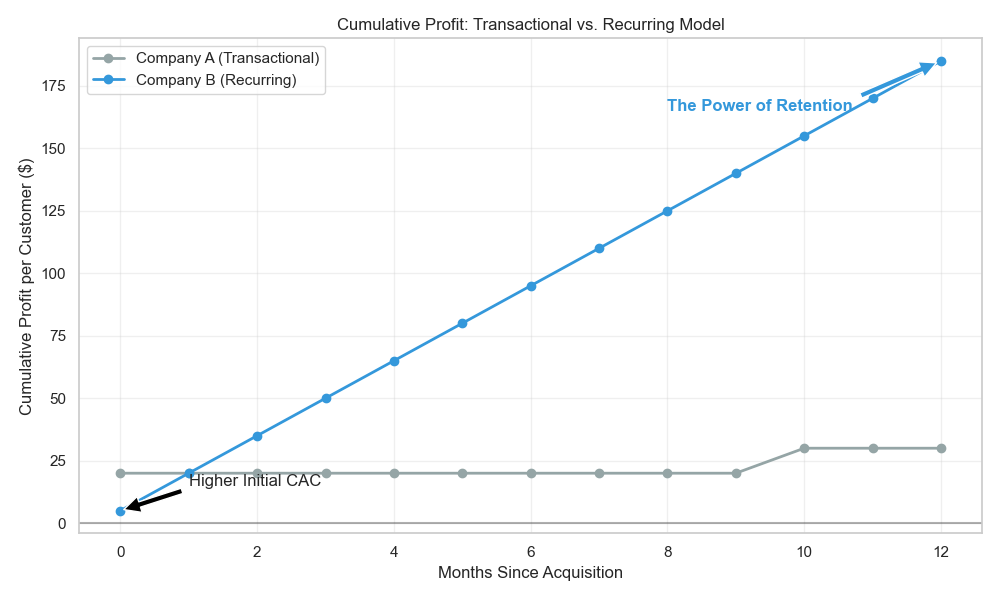
By Month 12, Company B has 5x the cumulative profit per customer. Company B never had to pay to re-acquire. Every transaction past the first is gross margin minus COGS, no media tax.
This isn't theoretical. Baketivity, a kids' baking subscription, found that single-purchase customers had dramatically lower LTV than subscribers. Switching to LTV-based bidding let them pay more upfront for the right customers and scale aggressively. Skincare brand Luminara discovered that 47% of their marketing budget was going to low-value buyers because of poor attribution; pivoting to an LTV-focused approach lifted ROAS 3.2x and got them to $18M ARR.
The Economics of Retention
The retention numbers are well-trodden but still worth restating because the industry keeps ignoring them:
- Acquiring a new customer costs 5-7x more than keeping one.
- A 5% increase in retention lifts profit by 25-95%.
- Probability of selling to an existing customer: 60-70%. Probability of selling to a prospect: 5-20%.
In a recurring model, retention is acquisition. If the customer stays, you don't have to replace them, your blended CAC drops, and operating margin compounds.
LTV: The New North Star
To shift away from ROAS, the primary KPI has to move to LTV. Done badly, LTV becomes a vanity metric. Done well, it lets you bid past competitors who are still optimizing for first-purchase profit.
Historical vs. Predictive LTV
Historical LTV (12-month, 24-month, 36-month) tells you what customers were worth. Useful for benchmarks, useless for tomorrow's bid. Predictive LTV uses early signals (first-order value, return speed, engagement) to estimate what a customer will be worth. If you know a customer is likely to be worth $500, you can pay $100 to acquire them and lose money on day one without flinching. Operators stuck on Day 1 ROAS can't.
Payback Period
The bridge between high CAC and high LTV is payback period: how long until cumulative margin covers acquisition cost.
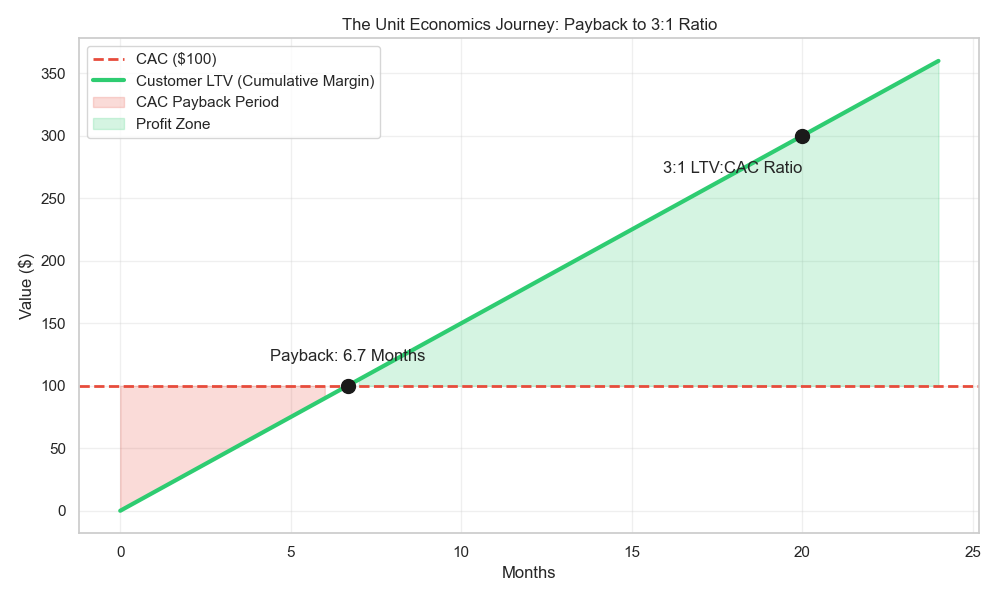
- Transactional: 0 months. Has to be profitable on the first order.
- SMB SaaS / subscription: 6-12 months.
- Enterprise: 12-18 months.
Shortening payback through upsells and retention is what frees up cash to reinvest in acquisition. It's the single lever that determines how fast you can responsibly grow.
The 3:1 Ratio
Operators and investors target an LTV:CAC ratio of 3:1.
- Below 1:1: losing money on every customer.
- 1:1: treading water.
- 3:1: healthy and scalable.
- 5:1: probably underspending; you're leaving growth on the table.
Calculating LTV Without Lying to Yourself
You know you need LTV. The question is how to actually compute it. Ask 10 founders, get 10 formulas, and most of them are wrong. A bad LTV number is worse than no number because it gives you false confidence.
The Wrong Way: Averaging Everything
The lazy formula is Total Revenue / Total Customers. It blends a customer acquired yesterday with one acquired three years ago. It blends Black Friday cohorts with low-intent organic traffic. If you set CAC targets off this number, you will overspend on the wrong segments and underspend on the right ones.
The Right Way: Cohort Analysis
The only honest way to measure LTV is by cohort: a group of customers who started in the same period (e.g. "Jan 2025 cohort"). Track each cohort separately and you see the actual retention curve, not a smeared average.
How to do it without a data team
You don't need infrastructure. You need a Shopify or Stripe export with three columns: Customer ID, Order Date, Order Value.
- Group customers by their first-purchase month. That's their cohort.
- For each cohort, track revenue in Month 0, Month 1, Month 2, etc.
- Cumulate the revenue and divide by the number of customers in that cohort. That's LTV per customer at each month.
Visualize it as a heatmap:
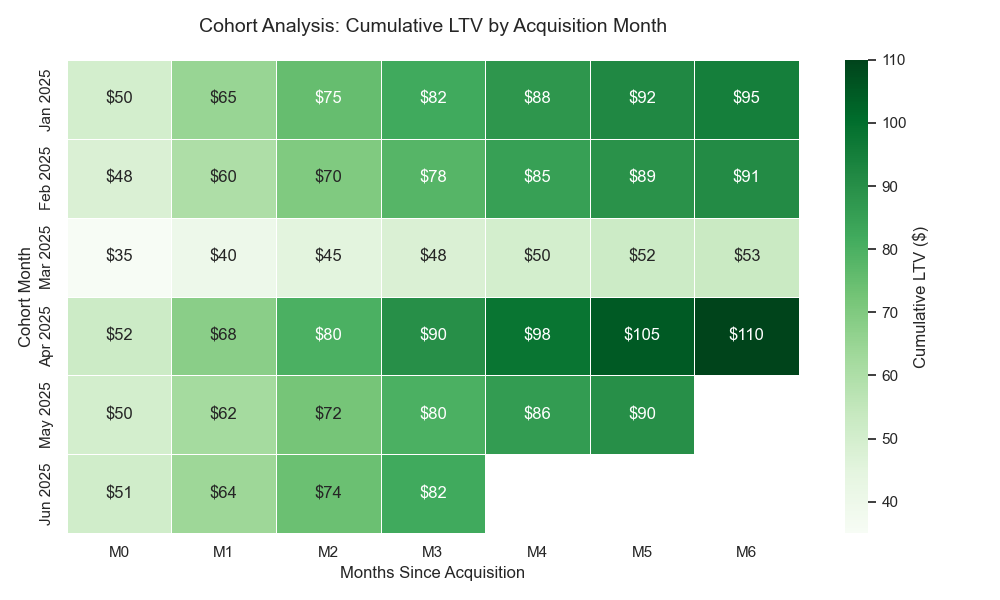
What this shows: Jan 2025 was strong, $50 at Month 0 climbing to $95 by Month 6. March was weak, $35 climbing slowly to $53. Average them and you miss it. Look at them separately and you ask the right question: what was different about March? (Probably a deep discount that pulled in low-quality buyers.)
Three Cohort Patterns to Watch For
- Leaky bucket. High Month 0 revenue, near-zero after. You have an acquisition product, not a retention product. Onboarding or first-experience is failing.
- Golden cohort. One specific month has 2x the LTV of others. Figure out what was different (channel, bundle, creative) and replicate it.
- Slow burn. Low first purchase, steady repeat for 12 months. These are usually your most profitable customers and they often come from organic or referral. Day 1 ROAS looks weak; Day 365 ROAS is enormous.
Three Formulas, Worst to Best
Back-of-napkin LTV. AOV x Purchase Frequency x Customer Lifespan. Easy. Assumes behavior never changes (it does). Use only for sanity checks.
Subscription LTV. ARPU / Churn Rate. $50 ARPU, 5% monthly churn = $1,000 LTV. Sensitive to churn. If churn doubles, LTV halves.
Margin LTV. The one to use for decisions: Cumulative Gross Profit per Customer - CAC. If you sell a $100 item that costs $60 to make and ship and you spent $30 to acquire, your net LTV is $10, not $100. Revenue LTV gets you fired. Margin LTV gets you funded.
Predictive LTV
Historical LTV has a fatal flaw: latency. To know your 12-month LTV you have to wait 12 months. By then the campaign is over, the budget is spent, and the team has moved on. Predictive LTV (pLTV) uses early signals to estimate future value, so you can act now.
What pLTV Actually Is
A model that takes a customer's first hours, days, or weeks of behavior and projects their value over 12 or 24 months. Historical LTV is reading the final score. pLTV is reading the first quarter and calling the game.
Signals that matter:
- First-order value: $15 trial item vs. $120 bundle.
- Product category: gateway product vs. one-off.
- Channel and source: branded search (high intent) vs. flash-sale ad (low intent).
- Engagement speed: welcome email opened in 2 hours? Browsed again within 48?
- Return behavior: refund initiated on day 3?
None of these are definitive on their own. Combined, they form a fingerprint that's surprisingly predictive.
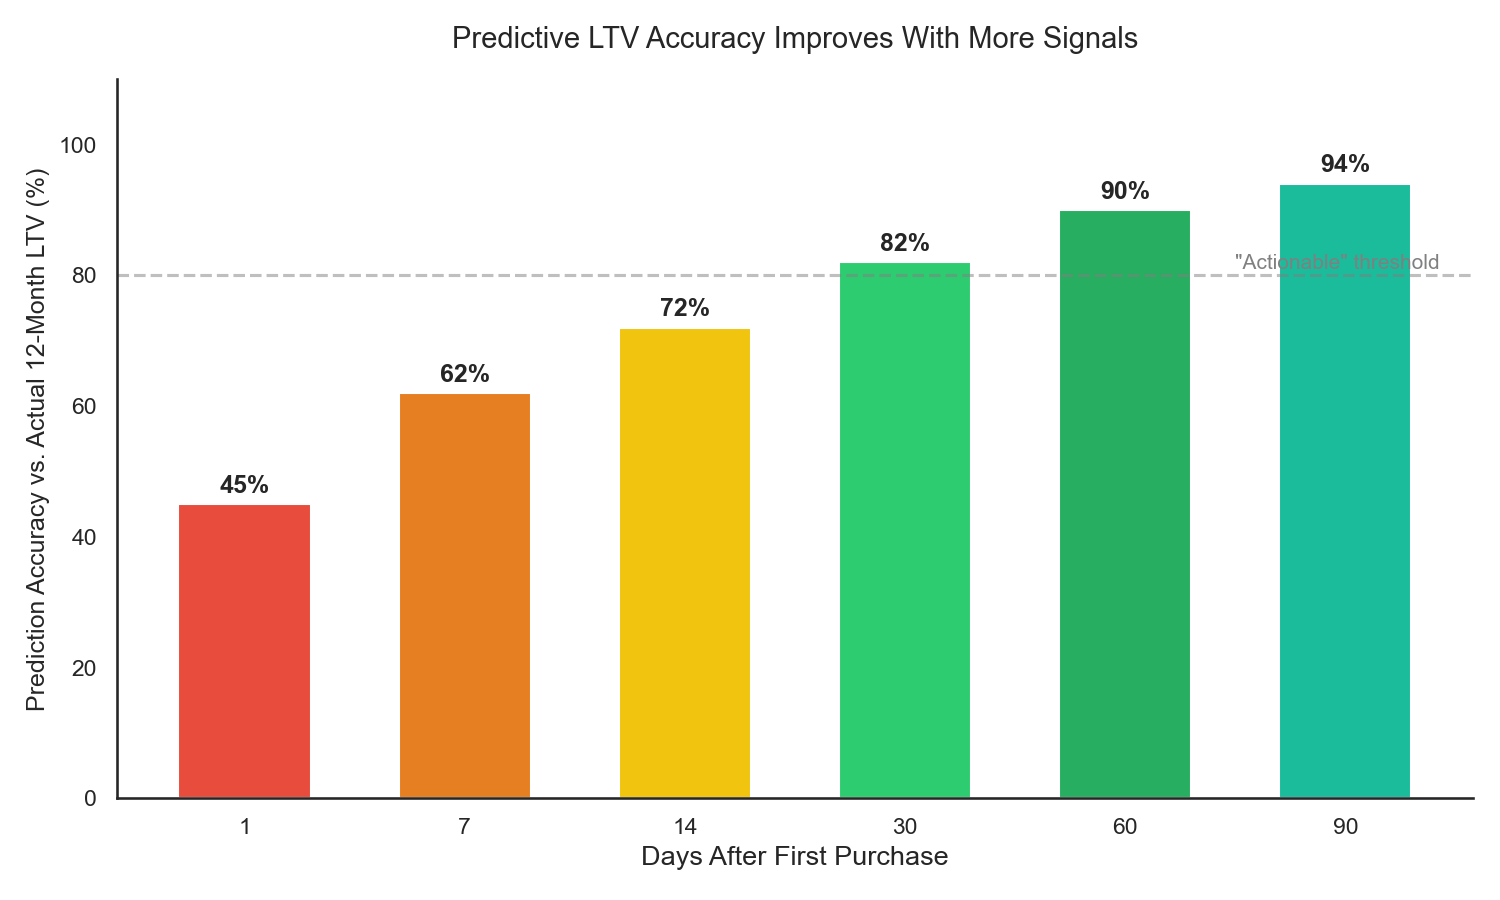
A well-calibrated model hits ~60% accuracy by Day 7 and 80%+ by Day 30. That's enough to outperform "wait 12 months and hope" by an enormous margin.
Five Ways pLTV Goes Wrong
I've watched these mistakes happen at Scentbird and in dozens of conversations with subscription founders.
1. Predicting revenue instead of margin. Model says $500 LTV. Marketing bids as if you have $500 to spend. But your margin is 40%, so you only have $200. Train on gross profit, not revenue.
2. Training on stale data. To predict 12-month outcomes you need customers with 12 months of history, which means your training data is at least a year old. Your product, pricing, and customer mix have all moved since. Use shorter windows (90-day pLTV) and retrain often.
3. One model for every use case. Marketing needs Day 1 pLTV for bidding. Finance needs Month 3 pLTV for forecasting. Product needs it segmented by feature usage. A single optimization will fail at least one team. Build separate models or validate against each requirement explicitly.
4. Ignoring the whale problem. In most subscription businesses, 5-10% of customers generate 50%+ of revenue. Standard ML models optimize for average accuracy and can be terrible at predicting the outliers who actually matter. Evaluate on percentile accuracy (top 10%, top 5%), not just R-squared.
5. Predicting without acting. A beautiful pLTV model on a dashboard nobody uses is wasted engineering. Every prediction must wire to a decision: high pLTV gets a higher bid; low pLTV gets a different onboarding flow. No action, no value.
How to Build It, Cheap to Sophisticated
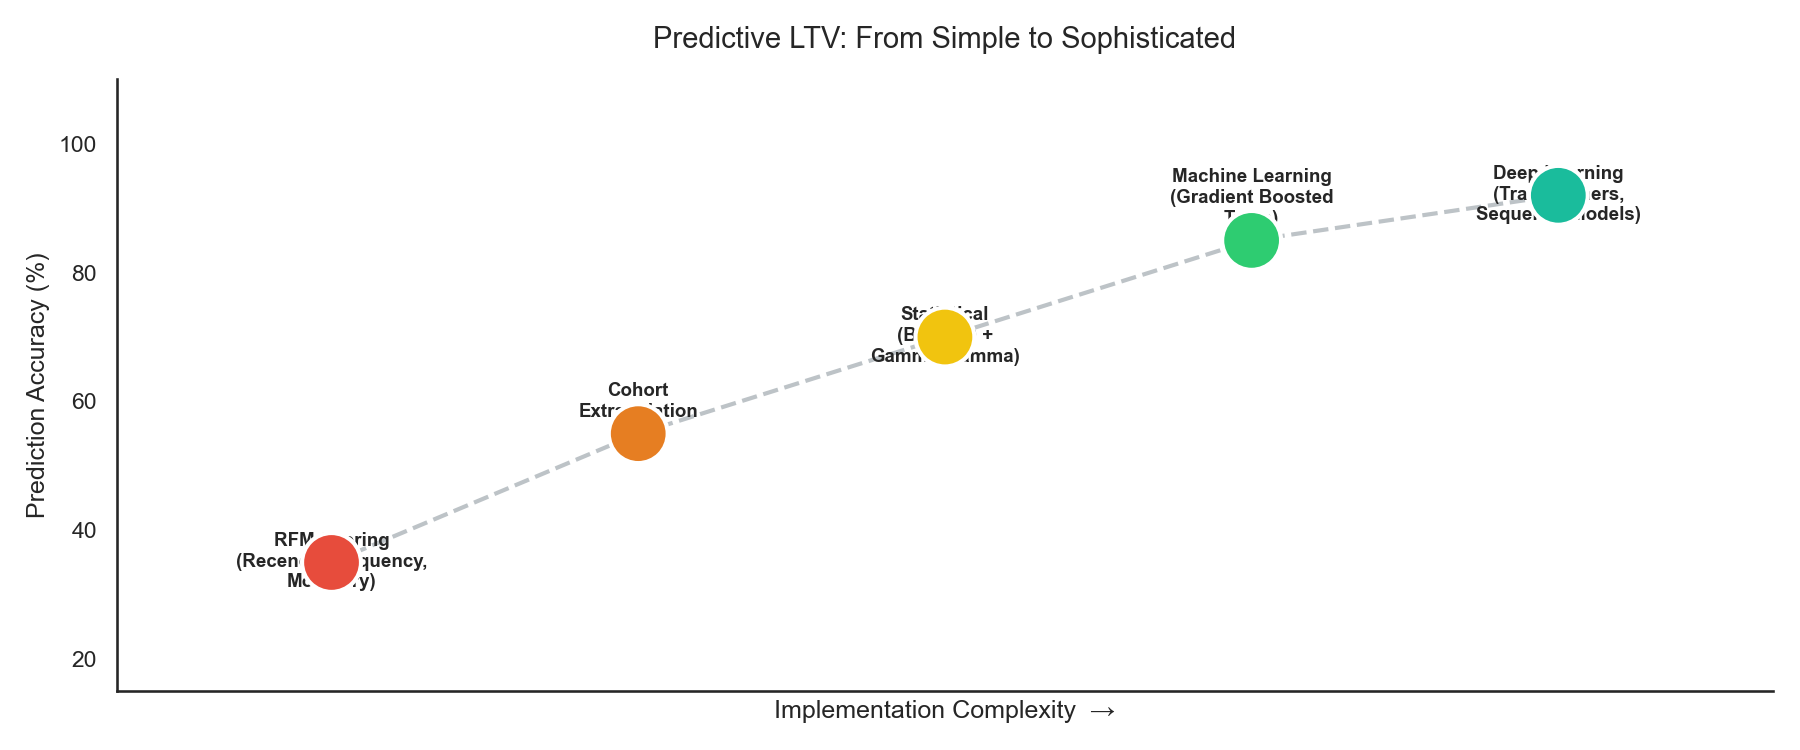
Level 1: RFM scoring. Recency, Frequency, Monetary. Score every customer in a spreadsheet, group into tiers. No ML required. Backward-looking, but a solid starting point.
Level 2: Cohort extrapolation. Take historical cohort curves and project them forward. If Month 6 is typically 70% of Month 12 LTV, you can estimate forward. Breaks when you change pricing, product, or channel mix.
Level 3: Statistical models (BG/NBD + Gamma-Gamma). Purpose-built probabilistic models for transaction data. Available in open-source libraries like lifetimes in Python. Handles "alive vs. dead" customer uncertainty. Doesn't capture engagement signals.
Level 4: Gradient boosted trees. Where most serious operators land. Train on hundreds of features (transactions, engagement, channel, product). Highly accurate, handles non-linear behavior, but needs feature pipelines and regular retraining. The whale problem needs explicit handling.
Level 5: Sequence models (deep learning). For companies with rich event-stream data: every click, page view, email open. State-of-the-art for the right business. Overkill below ~$50M ARR.
How to Use pLTV
Three highest-impact uses:
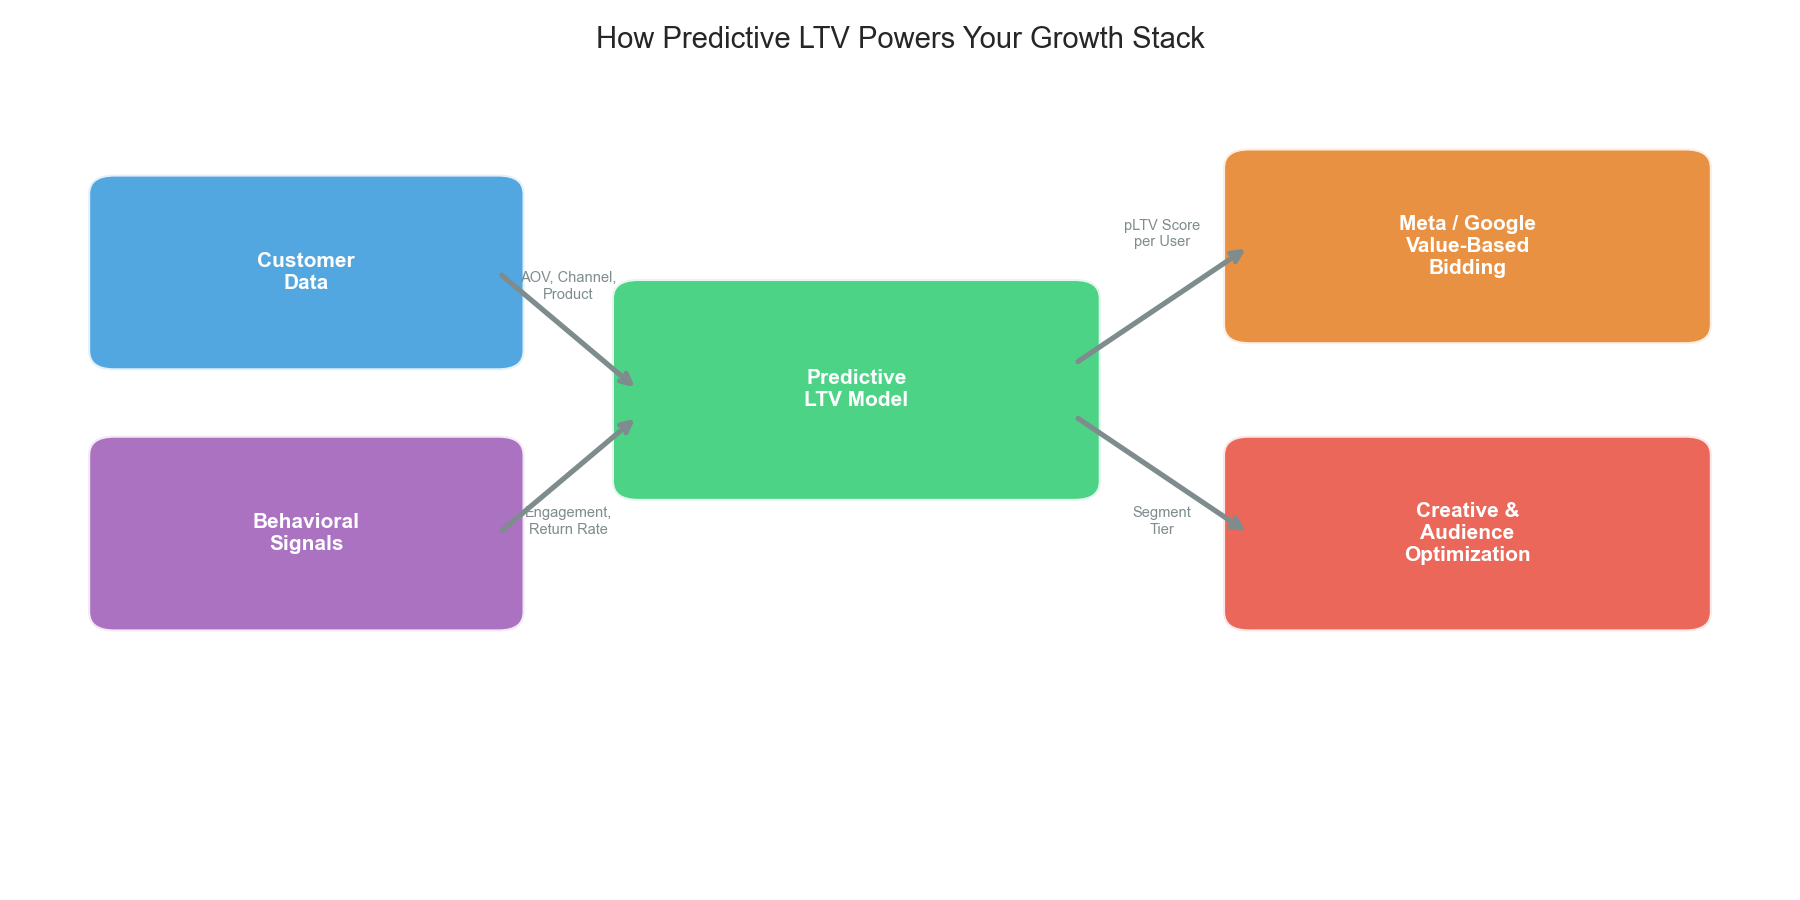
1. Value-based bidding on Meta and Google. Highest-ROI application. Instead of telling Meta "optimize for purchases" (which finds cheap one-time buyers), pass your pLTV score as the conversion value. Both platforms support this natively. The algorithm starts hunting for customers who stay.
Curology lifted ROAS 16% by feeding real-time pLTV scores into Google's value-based bidding. Good Clean Love reallocated a third of its budget toward predicted high-value customers and saw a substantial ROAS jump. Companies using pLTV-based bidding via platforms like Churney report ROAS improvements of +12% to +190%.
Timing is the trap. Your pLTV score has to reach the ad platform within minutes to hours of the conversion event. A score delivered 7 days later has almost no impact on the bidding model.
2. Creative and audience optimization. If high-pLTV customers buy the Starter Bundle and low-pLTV customers buy single discounted items, that's a creative strategy, not just a finance metric. Stop running "50% off" ads. Start running Starter Bundle ads. Build lookalikes from your high-pLTV customers, not from "all purchasers."
3. Retention triggers. High pLTV + low engagement is a red alert. Trigger a personalized winback. High pLTV + high engagement is a VIP. Surprise and delight. Low pLTV + high engagement is fine on standard flows.
How NOT to Use pLTV
Don't treat Day 1 pLTV as gospel. Day 1 accuracy is around 45%. Use it for directional decisions (bid up vs. bid down), not for committing to a quarter's spend.
Don't let pLTV justify infinite CAC. "Our pLTV is $500, we can spend $200 to acquire" is only true if your cash flow can survive the payback period. A startup with 6 months of runway can't afford a 12-month payback no matter how good the model looks.
Don't forget to retrain. A model trained in January and untouched will decay by summer. Customer behavior shifts with seasons, products, and competition. Quarterly retraining at minimum.
Don't optimize pLTV in a vacuum. A team obsessed with pLTV can lose sight of volume. Highest-LTV customers in the world are worthless if there are only 50 of them.
Who Does This Well
Spotify uses ML-driven LTV models to predict which free-tier users will convert to paid and targets them with upgrade offers at the right moment. Stitch Fix built the entire business around predictive customer value, with algorithms feeding everything from inventory purchasing to stylist assignments. Dollar Shave Club, pre-Unilever, was an early DTC brand to find that their cheapest channel (viral video) also produced their highest-LTV customers, an insight only pLTV analysis could have surfaced.
At Scentbird, we learned this the hard way. We discovered that customers acquired through influencer partnerships had 2x the LTV of customers acquired through discount-driven Facebook ads, but the Facebook cohort always looked better on Day 1 ROAS. Without pLTV we would have kept pouring money into the wrong channel for a long time. That experience is a big part of why we built Finsi.
The CFO-CMO Disconnect
By now you have the toolkit: cohort-based margin LTV, payback period, and a pLTV model feeding bids. Marketing is excited.
Your CFO looks at the numbers and says, "We're losing money."
You: "Our LTV:CAC is 3:1!"
CFO: "Great. We still can't make payroll in March."
This is the most common and most dangerous gap in growth-stage companies. Marketing and finance are looking at the same customers and seeing completely different stories. None of the previous chapters matter if these two teams aren't aligned.
Same Cohort, Two Stories
Take 1,000 customers acquired in January and look at them through both lenses.
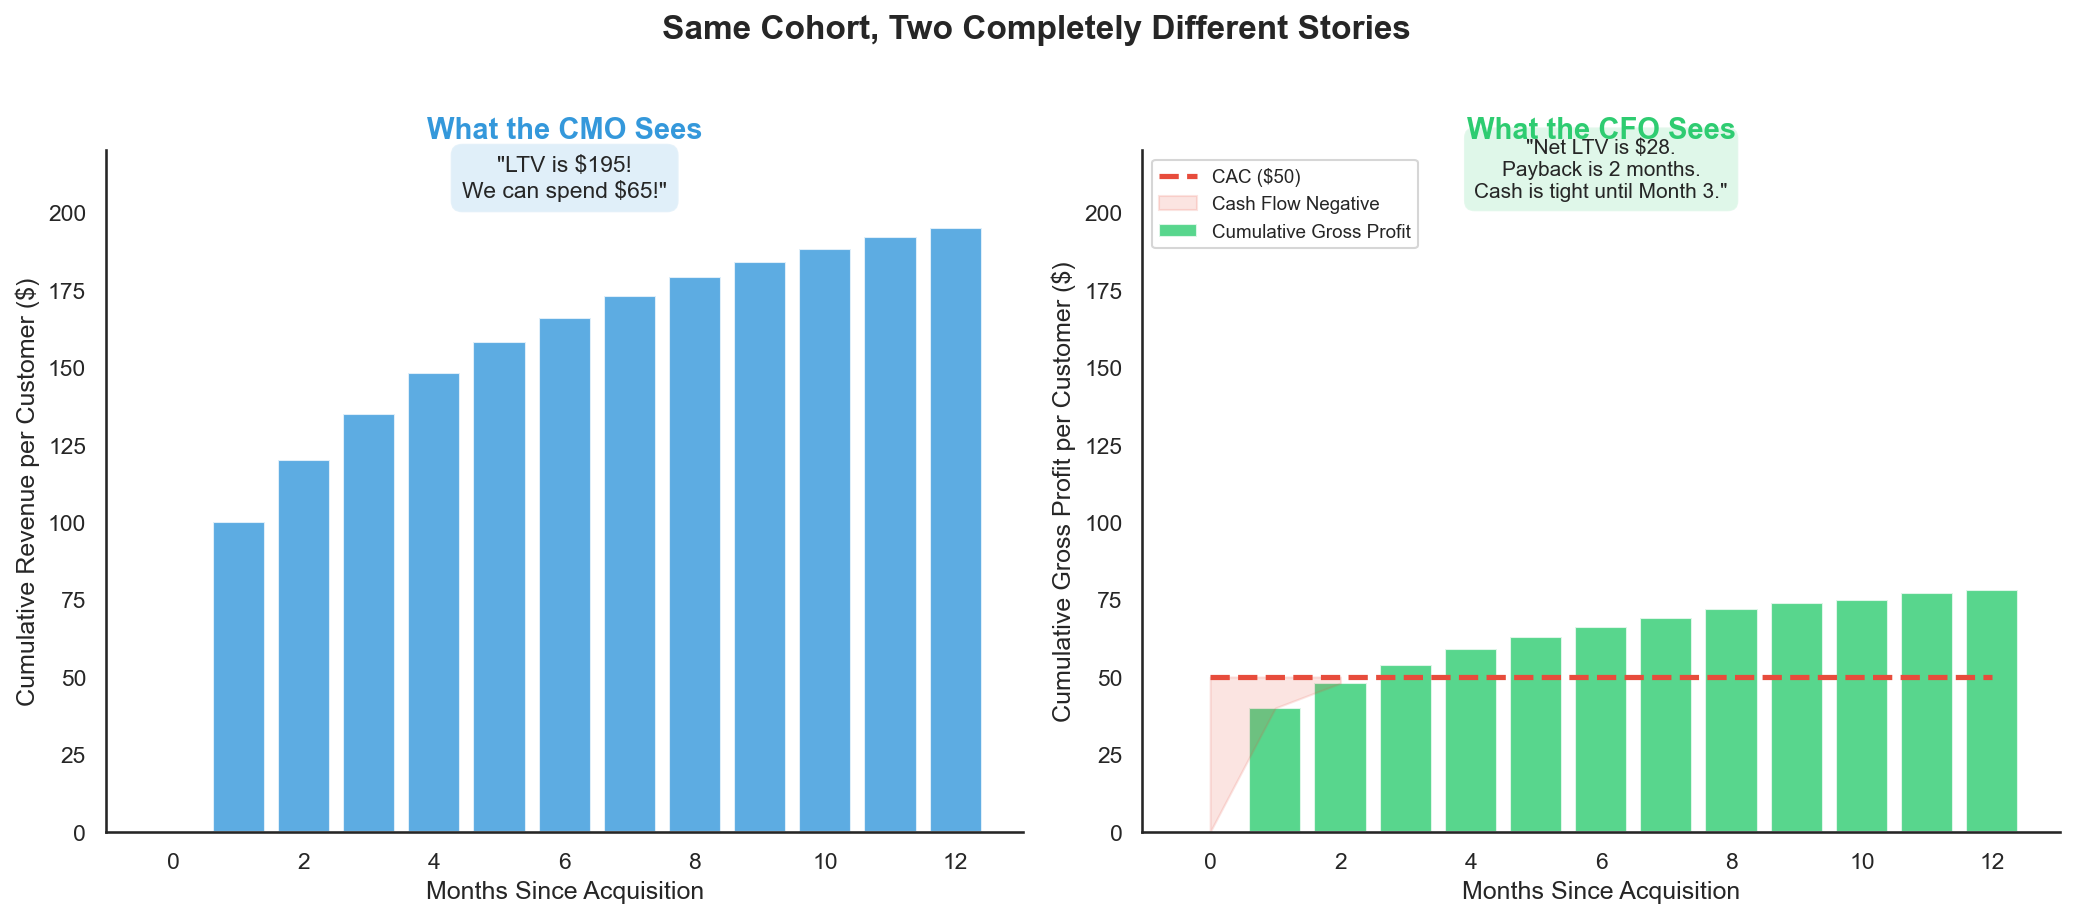
Marketing reports $195 LTV and a 4:1 ratio. Finance reports $28 net contribution and a 60-day cash hole. Both numbers are correct. Marketing stops at revenue; finance starts at gross profit. There are six layers in between, and every miscommunication lives in those layers.
The Unit Economics Waterfall
One customer through every P&L layer:
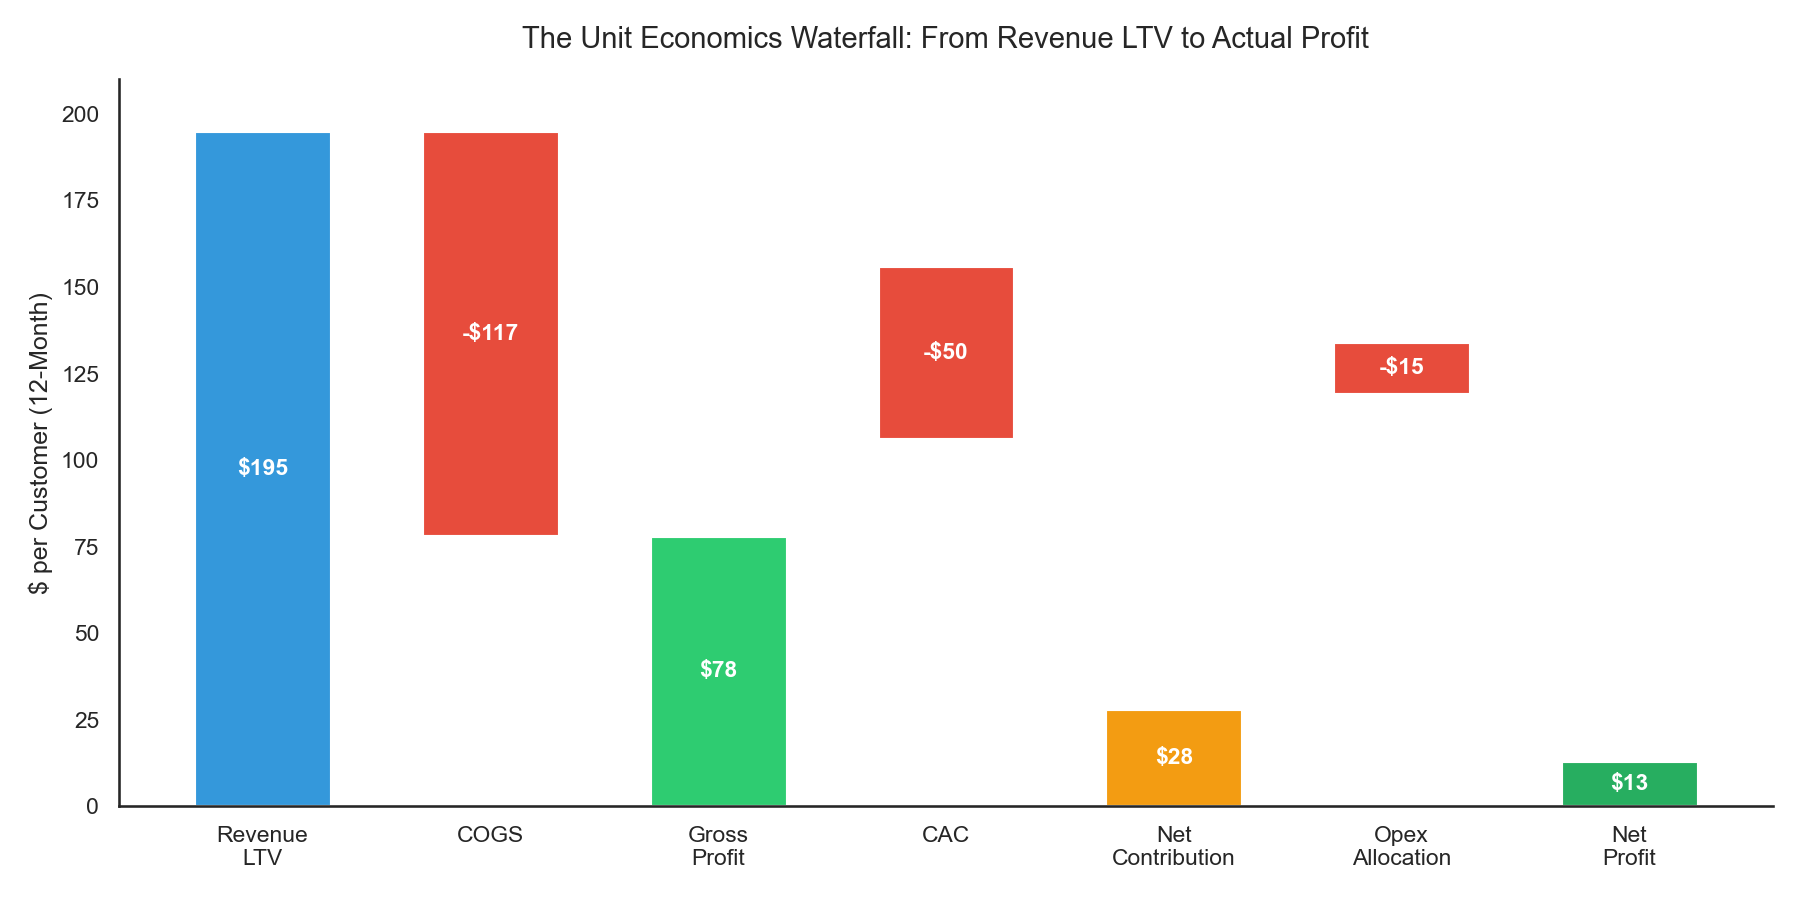
- Revenue LTV ($195): marketing's number.
- COGS (-$117): product, shipping, packaging, payment processing.
- Gross profit ($78): the margin LTV from earlier.
- CAC (-$50): fully loaded, including team salaries, agency fees, tools, creative production. Most companies undercount CAC by 30-50% by including only media spend.
- Net contribution ($28): what the customer actually contributes after acquisition and COGS.
- Opex allocation (-$15): the customer's share of fixed cost (engineering, office, support infra).
- Net profit ($13): what's actually left, per customer.
Marketing says $195. Finance says $13. The waterfall shows where the other $182 went.
The Cash-Flow Timing Problem
The waterfall doesn't fix timing.
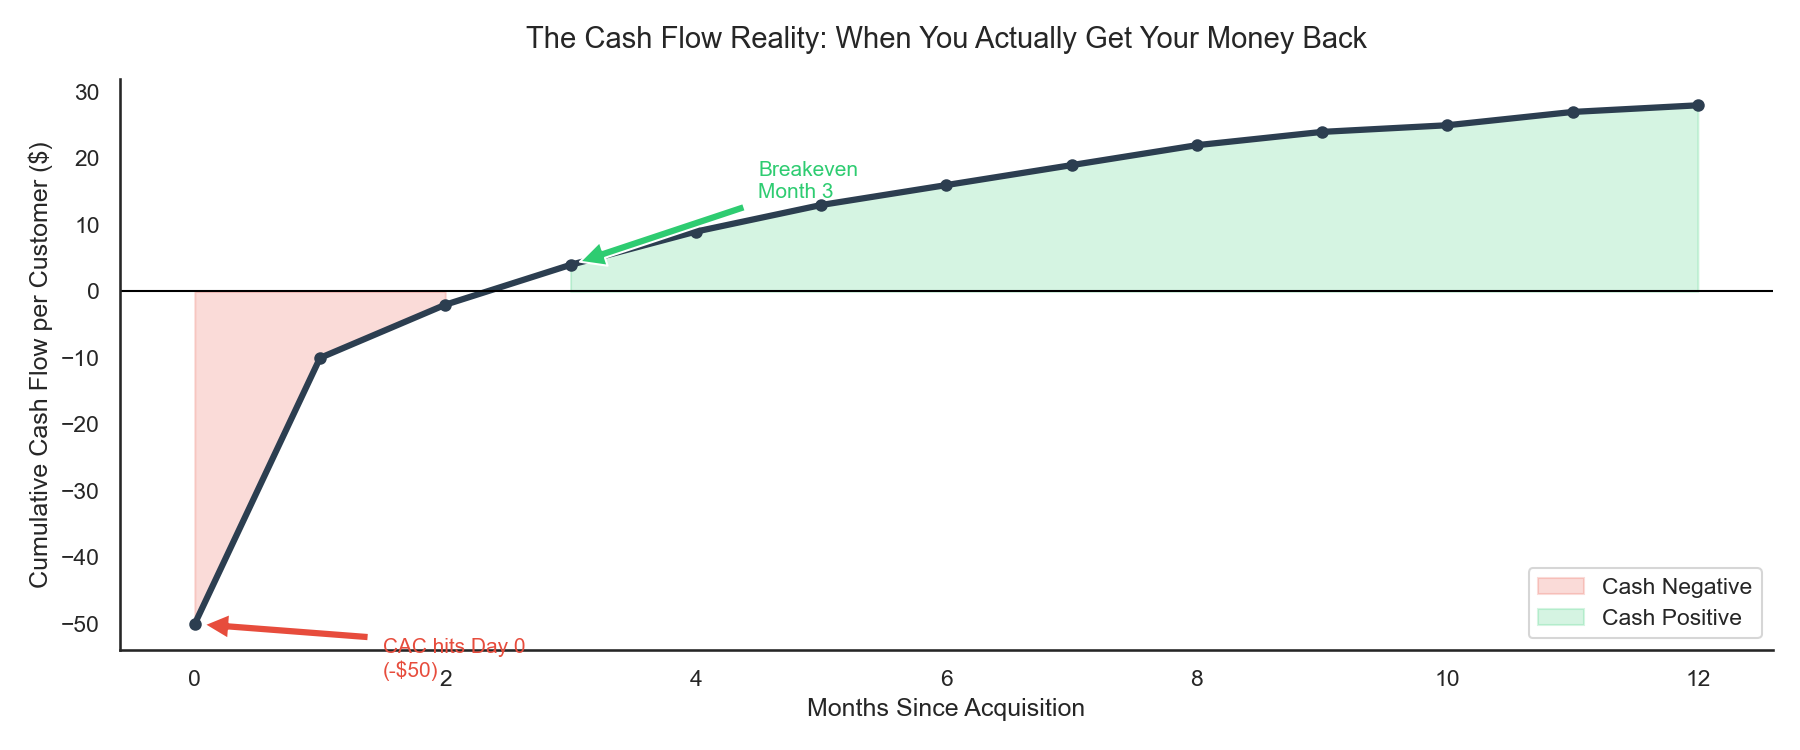
You spend $50,000 on Day 1 to acquire 1,000 customers. Revenue trickles in over 12 months. You don't break even on the cohort until Month 2, and you don't realize the full $28 net contribution until Month 12. Multiply that by 12 months of continuous acquisition and you're always financing the next cohort with cash you haven't collected yet. This is why fast-growing companies with positive unit economics still run out of money. Marketing sees a healthy ratio and says "scale faster." Finance sees a cash gap and says "slow down." Both are right; they're looking at different time horizons.
The Five Numbers
Every month, marketing and finance should agree on five numbers. Not dashboards. Five numbers.
1. Gross margin LTV. Not revenue LTV. Force the switch.
2. Fully loaded CAC. Ad spend plus salaries, agency fees, tools, creative.
3. Net contribution. Gross Margin LTV - Fully Loaded CAC. If negative, you're subsidizing growth with investor money.
4. Payback period. Months until cumulative margin covers CAC. The CFO's most important number because it determines how much cash you need to float growth.
5. Channel-level LTV:CAC. Not blended. Per channel. Branded search may be 5:1 while TikTok prospecting is 1.5:1. Blending hides which channels are subsidizing which.
The Budget Conversation
Before:
CMO: "I need $2M for Q2. LTV:CAC is 3:1, so every dollar returns three."
CFO: "Last quarter you spent $1.5M and gross margin didn't move proportionally. Where's the money going?"
Outcome: argument, delay, distrust.
After:
CMO: "Q2 ask is $2M. Cohort data says that acquires ~40,000 customers at fully-loaded CAC of $50. Gross margin LTV is $78. Net contribution per customer is $28, totaling $1.12M. Payback is 2 months, so we need to float $2M for 60 days before the first cohort breaks even. By end of Q2, Q1 cohort cash flow funds Q2 acquisition."
Outcome: approval, shared accountability, clear cash expectations.
Same request. Different language. Different result.
The Monthly Review
The best-run companies I've seen hold one 30-minute meeting per month between marketing and finance, working off a single shared model:
- Cohort tracking. How are the last 3 months of cohorts performing against the five numbers?
- Channel shifts. Are any channels getting more expensive? Reallocate?
- Cash-flow forecast. Based on current acquisition velocity and payback curves, when do we need additional capital?
- Model accuracy (if using pLTV). Are predictions holding up? Adjust bids?
This meeting prevents 90% of CMO-CFO arguments. At Scentbird, putting this cadence in place changed how we made decisions across the company.
The Path
The four ideas, in order:
- ROAS is fragile. The profit squeeze breaks transactional models on small cost shocks. Retention is the mathematical exit.
- Calculate LTV by cohort, on margin, never on averages. Without this, every downstream decision is built on sand.
- Predictive LTV lets you act on the future instead of waiting for the past. It powers value-based bidding, creative, and retention triggers.
- None of it matters if marketing and finance aren't speaking the same language. The waterfall and the five numbers are the bridge.
The companies that win in 2026 will be the ones where marketing, finance, and product all operate from the same unit-economics model and make decisions at the speed the market demands. Most $5M-$100M brands don't have the data team to build that on their own; that's a big part of why we built Finsi.
References
- Artisan Growth Strategies. Customer Acquisition Vs Retention Costs (2025)
- Adventure PPC. Baketivity YoY Growth After LTV Analysis
- LayerFive. How a Premium DTC Skincare Brand Scaled to $18M ARR
- Propel. Customer Retention Statistics Report 2025
- Taboola. Beyond ROAS: Why LTV is the Metric That Matters
- AppsFlyer. Pitfalls of Modeling LTV
- Tamaki, R. Forecasting Customer Lifetime Value
- Ocurate. Real-time LTV for Value-Based Bidding
- Churney. Predictive LTV Bidding Case Studies
- Angler. Predictive LTV-Based Bidding on Meta and Google
- Marketing AI Institute. How Spotify Uses AI