The Profit Paradox: Why ROAS is a Trap and Retention is the Only Way Out

The ROAS Addiction
For the last decade, the direct-to-consumer (DTC) and SaaS industries have been addicted to a single metric: ROAS (Return on Ad Spend).
The playbook was simple: Put $1 into Meta or Google. Get $3 back immediately. Scale the budget until the machine breaks. This era of "arbitrage marketing" created unicorns overnight, but it also trained an entire generation of founders and marketers to optimize for Day 1 profitability.
But the math has fundamentally changed.
According to recent industry data, customer acquisition costs (CAC) have surged by 222% over the last five years [1]. Meanwhile, signal loss from privacy changes (iOS 14+) has made attribution murky, often leading brands to overspend on low-value customers.
Despite this, 44% of businesses still prioritize acquisition over retention [1]. They are running on a treadmill that is getting faster and steeper every month.
This article explores why the old ROAS-centric model is broken, the mathematical reality of the "profit squeeze," and why shifting to a retention-first LTV model is the only path to sustainable growth in 2026.
The Math of Fragility: The Profit Squeeze
Most companies operating on a "first-purchase profitability" model are far more fragile than they realize. When you optimize for transactional margin, you have zero room for error.
Let’s look at the mathematics of a "Profit Squeeze."
Consider a healthy e-commerce business with the following unit economics:
- AOV: $100
- Gross Margin: 60% ($60)
- CAC: $30
- Net Profit: $30
This looks like a solid business. You have a 30% net margin on the first order.
But what happens when the market tightens? Let’s assume two very realistic scenarios happen simultaneously:
- CAC increases by 10% (due to competition or ad costs). New CAC: $33.
- Margin decreases by 10% (due to supply chain costs or discounting). New Margin: $54.
These are minor fluctuations. But look at the impact on the bottom line:
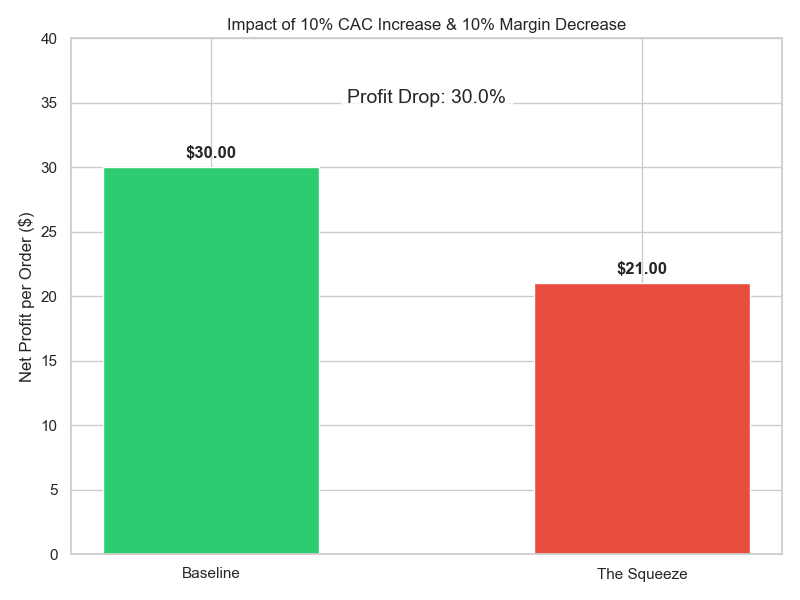
- Baseline Profit: $30
- New Profit: $21
A 10% shift in costs wiped out 30% of your profit.
This is the danger of the transactional model. Operating leverage works both ways. When you rely entirely on acquiring new customers for profit, small headwinds in ad performance or COGS can devastate your net income.
A Tale of Two Companies: Transactional vs. Recurring
To understand the alternative, we must look at how retention changes the equation. Let’s compare two hypothetical companies with identical products but different business models.
Company A: The Transactional Retailer
- Strategy: Optimizes for Day 1 ROAS.
- Metrics: Low CAC ($30), High Day 1 Profit.
- Retention: Afterthought (1 purchase/year).
Company B: The Recurring Revenue Engine
- Strategy: Optimizes for LTV (Lifetime Value).
- Metrics: Willing to pay higher CAC ($45) to acquire "best-fit" subscribers.
- Retention: Core focus (Subscription or high repeat rate).
In Month 1, Company A looks like the winner. They banked $20 in profit per customer, while Company B only made $5.
But retention is a compounding force. By Month 12, the picture changes dramatically:
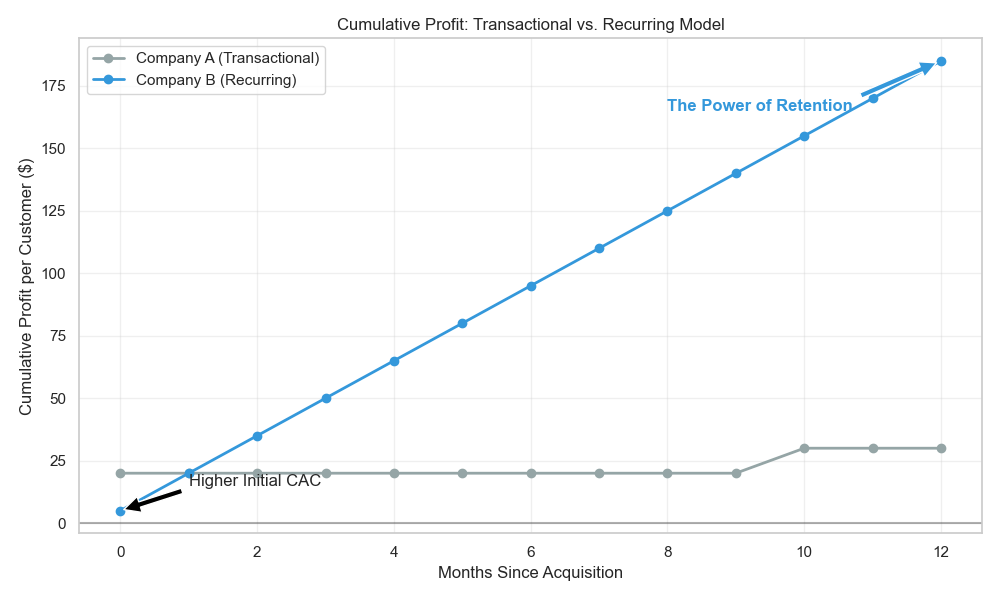
By Month 12, Company B has generated 5x the cumulative profit of Company A.
Why? Because Company B didn't have to pay to acquire that customer again. Every subsequent transaction is pure margin (minus COGS).
Case Study: Baketivity
This isn't just theory. Baketivity, a kids' baking subscription service, found that standard ROAS metrics were misleading. When they analyzed their data, they discovered that single-purchase customers had significantly lower LTV compared to subscription cohorts.
By shifting their focus to LTV-based ROAS, they realized they could afford to bid higher to acquire subscription customers. This insight allowed them to scale aggressively, knowing that the higher upfront CAC would be paid back many times over by the recurring revenue [2].
Similarly, skincare brand Luminara found that 47% of their marketing budget was being wasted on low-value customers due to poor attribution. By pivoting to an LTV-focused strategy, they improved their ROAS by 3.2x and scaled to $18M ARR [3].
The Economics of Retention
The data on retention is staggering, yet often ignored in favor of the dopamine hit of a new sale.
- Cost Efficiency: It costs 5-7x more to acquire a new customer than to retain an existing one [1].
- Profit Impact: A mere 5% increase in retention can increase profits by 25% to 95% [4].
- Success Rate: The probability of selling to an existing customer is 60-70%, compared to just 5-20% for a new prospect [1].
In a recurring model, "Retention is the new Acquisition." If you can keep a customer, you don't need to replace them. This lowers your effective blended CAC and increases your operating margin over time.
LTV: The New North Star
To make this shift, you need to move your primary KPI from ROAS to LTV. But "LTV" can be a vanity metric if not calculated correctly.
1. Historical vs. Predictive LTV
- Historical LTV (LTV 12, 24, 36): This looks in the rearview mirror. It tells you what customers were worth. While useful for benchmarking, it’s a lagging indicator.
- Predictive LTV: This is the gold standard. Using machine learning (like we do at Finsi), you analyze early signals—first purchase value, return speed, engagement—to predict a customer's future value.
If you know a customer has a Predicted LTV of $500, you can confidently spend $100 to acquire them, even if it means losing money on the first transaction. This is how you outbid competitors who are stuck optimizing for a $50 Day 1 profit.
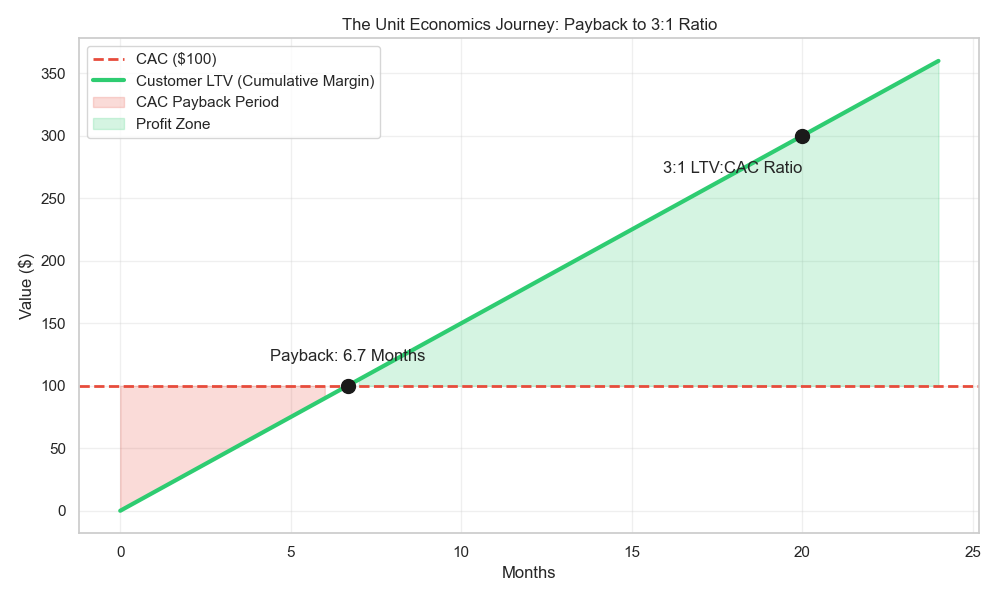
2. The Payback Period
The bridge between high CAC and high LTV is the Payback Period—the time it takes for a customer’s cumulative margin to cover their acquisition cost.
- Transactional: Needs immediate payback (0 months).
- SMB SaaS/Subscription: Typically 6-12 months.
- Enterprise: Can be 12-18 months.
The goal is to shorten this period through upsells and retention, freeing up cash flow to reinvest in acquisition.
3. The Golden Ratio (3:1)
Investors and smart operators aim for an LTV:CAC ratio of 3:1.
- < 1:1: You are losing money on every customer.
- 1:1: You are treading water.
- 3:1: You have a healthy, scalable business.
- 5:1: You are likely under-spending and growing too slowly.
Chapter 2: The Art and Science of Calculating LTV
You know you need to focus on LTV. But how do you actually calculate it? Ask 10 founders, and you’ll get 10 different formulas. Most of them are wrong.
Calculating LTV incorrectly is worse than not calculating it at all. It gives you false confidence, leading you to either overspend (and burn cash) or underspend (and lose market share).
Here is the definitive guide to calculating LTV without lying to yourself.
The Wrong Way: The "Average" Trap
The most common mistake is taking averages across your entire customer base.
The Lazy Formula:
Total Revenue / Total Customers = Average LTV
Why it fails: It treats a customer acquired yesterday the same as a customer acquired 3 years ago. It blends your "best" cohorts (e.g., Black Friday shoppers) with your "worst" cohorts (e.g., low-intent organic traffic).
If you use this number to set your CAC targets, you will fail. You need granularity.
The Right Way: Cohort Analysis
The only accurate way to measure LTV is by Cohort. A cohort is simply a group of customers who started at the same time (e.g., "Jan 2025 Cohort").
By tracking these groups separately, you can see the true retention curve.
How to Calculate It (Even If You Have Nothing)
You don't need a data science team or a fancy dashboard to do this. You can start with a simple spreadsheet.
Step 1: Gather Your Data You only need three columns of data from your Shopify/Stripe export:
Customer ID(Who bought?)Order Date(When?)Order Value(How much?)
Step 2: Build the "Layer Cake" Group your customers by the month they made their first purchase. This is their "Cohort Month." Then, track how much revenue that specific group generated in Month 0 (their first month), Month 1, Month 2, etc.
Step 3: Calculate Cumulative Revenue Add up the revenue over time.
- Month 0: $10,000
- Month 1: +$2,000 (Total $12,000)
- Month 2: +$1,000 (Total $13,000)
Divide by the number of customers in that cohort to get LTV per Customer.
Visualizing the Result
Once you have your spreadsheet set up, you can visualize it like this:
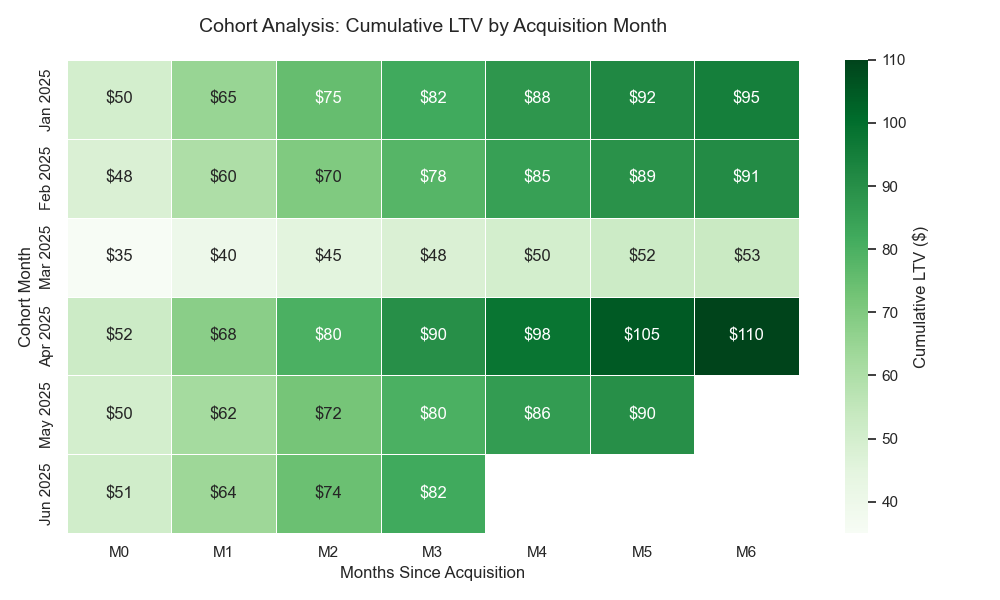
What this chart tells you:
- Jan 2025: A strong cohort. They started at $50 and grew to $95 by Month 6.
- Mar 2025: A weak cohort. They started lower ($35) and grew slowly ($53). Maybe you ran a deep discount promo that attracted low-quality buyers?
If you had just averaged them, you’d miss this insight. You might have doubled down on the March strategy, not realizing it was bringing in "bad" revenue.
Patterns to Look For in Cohorts
Once you have your cohorts visualized, look for these three common patterns:
The "leaky Bucket" (Steep Drop-off)
- Pattern: High Month 0 revenue, then near-zero revenue in Month 1 and 2.
- Diagnosis: You have an acquisition product, not a retention product. Your onboarding or first-unboxing experience is failing.
The "Golden Cohort" (The Outlier)
- Pattern: One specific month (e.g., November) has 2x the LTV of others.
- Diagnosis: Analyze what you did differently. Did you acquire from a specific channel? Did you sell a specific bundle? Clone this strategy.
The "Slow Burn" (Late Bloomers)
- Pattern: Low initial spend, but steady purchases every month for 12 months.
- Diagnosis: These are your most profitable customers. They often come from organic channels or referrals. They might have a lower ROAS on Day 1, but a massive ROAS on Day 365.
The Formulas: From Basic to Advanced
1. The "Back of Napkin" LTV (Good for quick checks)
Average Order Value (AOV) × Purchase Frequency × Customer Lifespan
- Pros: Easy to calculate.
- Cons: Assumes behavior is constant forever (it’s not).
2. The "Subscription" LTV (SaaS/Box models)
ARPU (Average Revenue Per User) / Churn Rate
- Example: $50 ARPU / 5% Monthly Churn = $1,000 LTV.
- Cons: Highly sensitive to Churn Rate. If churn spikes to 10%, LTV halves to $500.
3. The "Real" LTV (Net Margin LTV)
This is the one you should use for financial planning. Revenue is vanity; margin is sanity.
Cumulative Gross Profit per Customer - CAC
Why Gross Profit? If you sell a $100 item but it costs $60 to make and ship, your LTV isn't $100. It's $40. If you spend $30 to acquire them, your Net LTV is $10.
Common Mistake: Confusing Revenue LTV with Margin LTV.
- Revenue LTV: "I can spend $100 to get a customer!" (No, you can't).
- Margin LTV: "I have $40 of margin to play with." (Yes, you do).
Chapter 3: Predictive LTV — The Holy Grail (and How Not to Screw It Up)
In Chapter 2, we learned how to calculate historical LTV using cohort analysis. But historical LTV has a fatal flaw: Latency.
To know your "12-Month LTV," you have to wait... 12 months. By then, the campaign is over, the budget is spent, and the team has moved on.
In 2026, you don't have time to wait. Your competitors are making acquisition decisions in real time. You need to know what a customer is worth today, not next year.
This is the promise of Predictive LTV (pLTV): using data and models to forecast the future value of a customer based on their earliest behavior signals.
But pLTV is also the most misunderstood and misimplemented metric in the growth stack. Let's break it down properly.
What Predictive LTV Actually Is
Predictive LTV is a model that takes a customer's early signals — what they did in their first hours, days, or weeks — and projects their total value over a longer horizon (typically 12 or 24 months).
Think of it this way:
- Historical LTV is reading the final score after the game is over.
- Predictive LTV is reading the first quarter and calling the final score.
The model looks at signals like:
- First Order Value: Did they buy a $15 trial item or a $120 bundle?
- Product Category: Did they buy a "gateway" product that historically leads to repeat purchases?
- Channel & Source: Did they come from a branded search (high intent) or a flash-sale ad (low intent)?
- Engagement Speed: Did they open the welcome email within 2 hours? Did they browse again within 48 hours?
- Return Behavior: Did they initiate a return on Day 3?
None of these signals alone are definitive. But combined, they form a fingerprint that is remarkably predictive of long-term behavior.
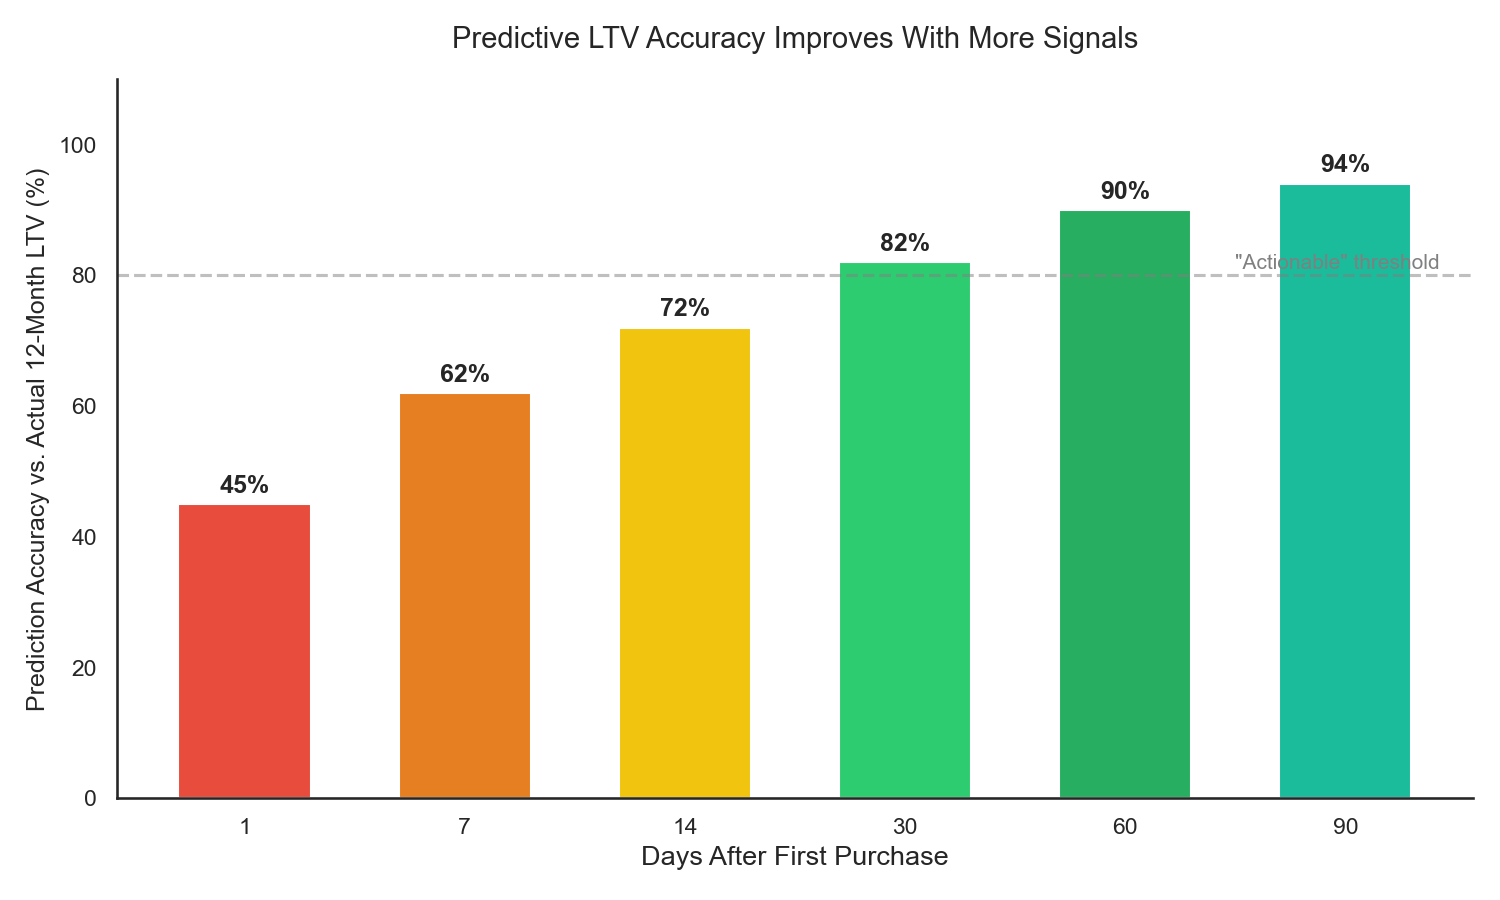
As the chart shows, a well-calibrated model can reach ~60% accuracy by Day 7 and above 80% by Day 30. That is enough to make significantly better acquisition and retention decisions than the alternative of guessing or waiting 12 months.
The 5 Mistakes People Make with Predictive LTV
Before we discuss how to build it, let's talk about how people get it wrong. These are mistakes I've seen firsthand at Scentbird and in dozens of conversations with subscription and e-commerce founders.
Mistake #1: Using Revenue Instead of Margin The most common error. Your pLTV model predicts $500 in revenue, and your marketing team bids as if you have $500 to spend. But if your margin is 40%, you actually have $200. Overshoot your CAC by even a little, and you're underwater. Fix: Always train your model on Gross Profit, not Revenue.
Mistake #2: Training on Stale Data To predict 12-month LTV, you need customers who already have 12 months of history. That means your training data is at least a year old. But your product has changed. Your pricing has changed. Your customer mix has changed. The model is learning from a world that no longer exists [6]. Fix: Use shorter prediction windows (90-day pLTV) and retrain frequently. A model trained on 90-day outcomes with 3-month-old data is far more reliable than a 12-month model trained on 2-year-old data.
Mistake #3: One Model to Rule Them All Different teams need different things from pLTV. Marketing needs it on Day 1 to set bids. Finance needs it at Month 3 for forecasting. Product needs it segmented by feature usage. A single model optimized for one use case will fail the others [7]. Fix: Build separate models for separate use cases, or at minimum, validate your model against each team's requirements independently.
Mistake #4: Ignoring the "Whale" Problem In many businesses, 5-10% of customers generate 50%+ of revenue. Standard ML models (like gradient boosted trees) optimize for average accuracy, which means they can be terrible at predicting these outlier "whale" customers. Your model might be 90% accurate overall but completely miss the customers who matter most [6]. Fix: Evaluate your model on percentile accuracy (top 10%, top 5%), not just overall R-squared. Consider separate models or rules for high-value segments.
Mistake #5: Predicting Without Acting This one is subtle. You build a beautiful pLTV model, put it on a dashboard, and... nothing changes. The marketing team still bids on ROAS. The retention team still sends the same emails to everyone. A prediction without an action is just an expensive number. Fix: Every prediction must be wired to a decision. If pLTV is high → increase bid. If pLTV is low → trigger a specific onboarding flow. No action, no value.
How to Build It: From Simple to Sophisticated
You don't need to start with deep learning. In fact, you shouldn't. Here is the progression from simple to advanced:
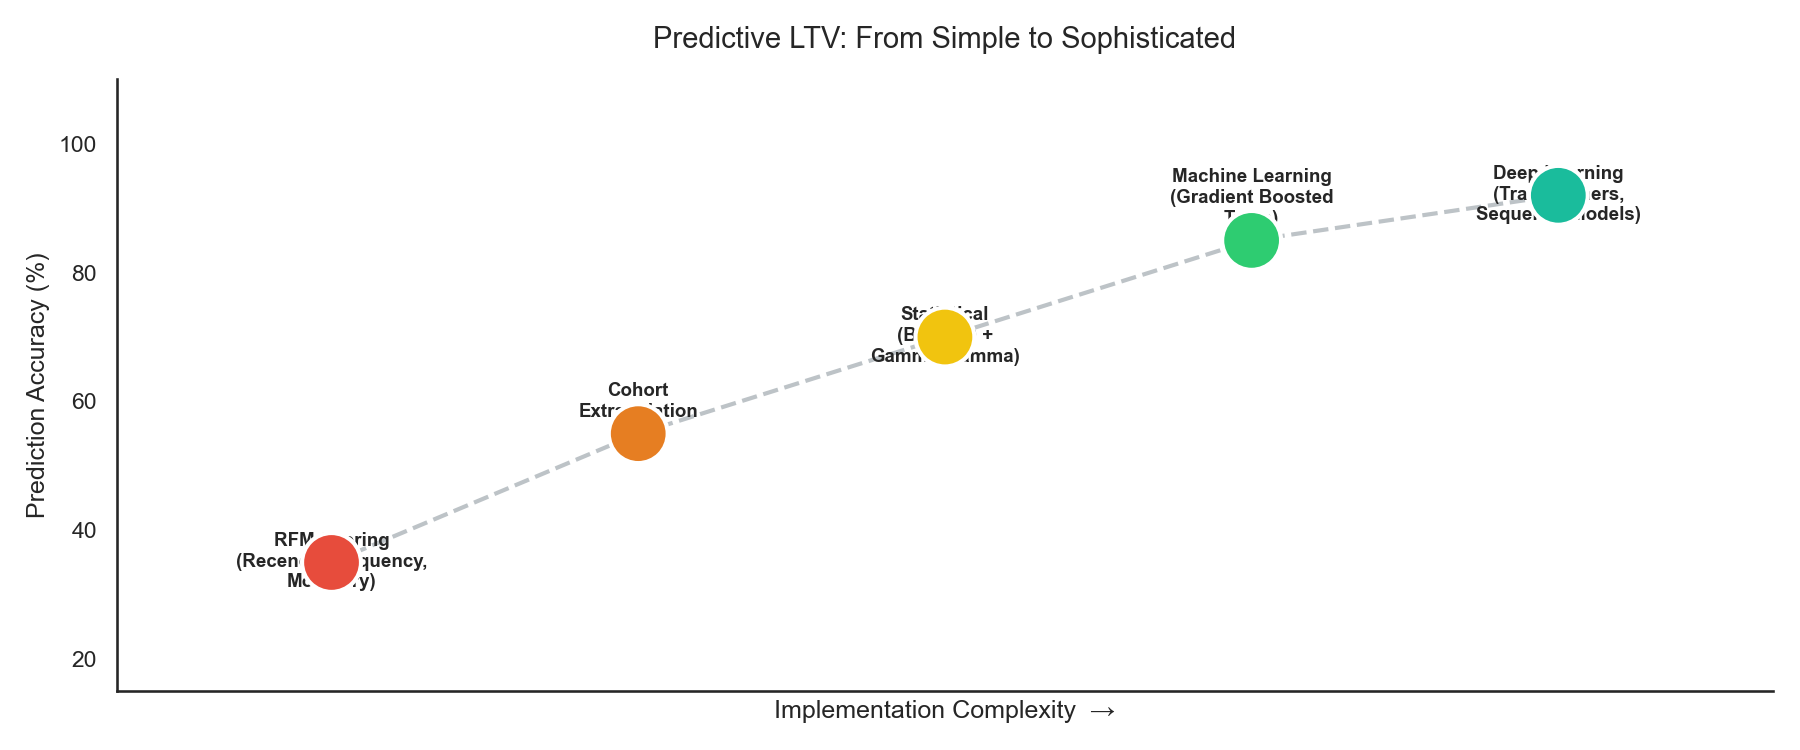
Level 1: RFM Scoring (Start Here)
Recency, Frequency, Monetary — the classic framework. Score each customer on how recently they bought, how often, and how much they spent. Group them into tiers (Top 20%, Middle 60%, Bottom 20%).
- Pros: No ML required. You can do it in a spreadsheet.
- Cons: It's backward-looking and doesn't predict future behavior. It tells you who was valuable, not who will be.
Level 2: Cohort Extrapolation
Take your historical cohort curves (from Chapter 2) and project them forward. If your Jan 2025 cohort generated $80 LTV by Month 6, and your historical data shows that Month 6 is typically 70% of Month 12 LTV, then you can estimate Month 12 LTV at ~$114.
- Pros: Uses real data. Simple math.
- Cons: Assumes the future looks like the past. Breaks when you change pricing, product, or channel mix.
Level 3: Statistical Models (BG/NBD + Gamma-Gamma)
These are purpose-built probabilistic models for customer transaction data. BG/NBD predicts whether a customer will buy again (and when). Gamma-Gamma predicts how much they will spend. Combined, they give you a proper pLTV estimate.
- Pros: Academically proven. Handles "alive vs. dead" customer uncertainty well. Available in open-source libraries (like
lifetimesin Python). - Cons: Requires clean transaction data. Doesn't incorporate behavioral signals (email opens, browsing, etc.).
Level 4: Machine Learning (Gradient Boosted Trees)
This is where most serious companies land. You train a model on hundreds of features — transaction data, engagement data, channel data, product data — to predict LTV at a customer level.
- Pros: Highly accurate. Can incorporate any signal. Handles non-linear relationships.
- Cons: Requires data engineering, feature pipelines, and regular retraining. The "whale" problem (Mistake #4) needs careful handling.
Level 5: Deep Learning (Sequence Models)
For companies with rich event-stream data (every click, every page view, every email open), sequence models like Transformers can capture complex temporal patterns.
- Pros: State-of-the-art accuracy for businesses with dense data.
- Cons: Requires significant engineering investment. Overkill for most companies under $50M ARR.
How to Use Predictive LTV
A prediction without an action is a waste. Here are the three highest-impact uses:
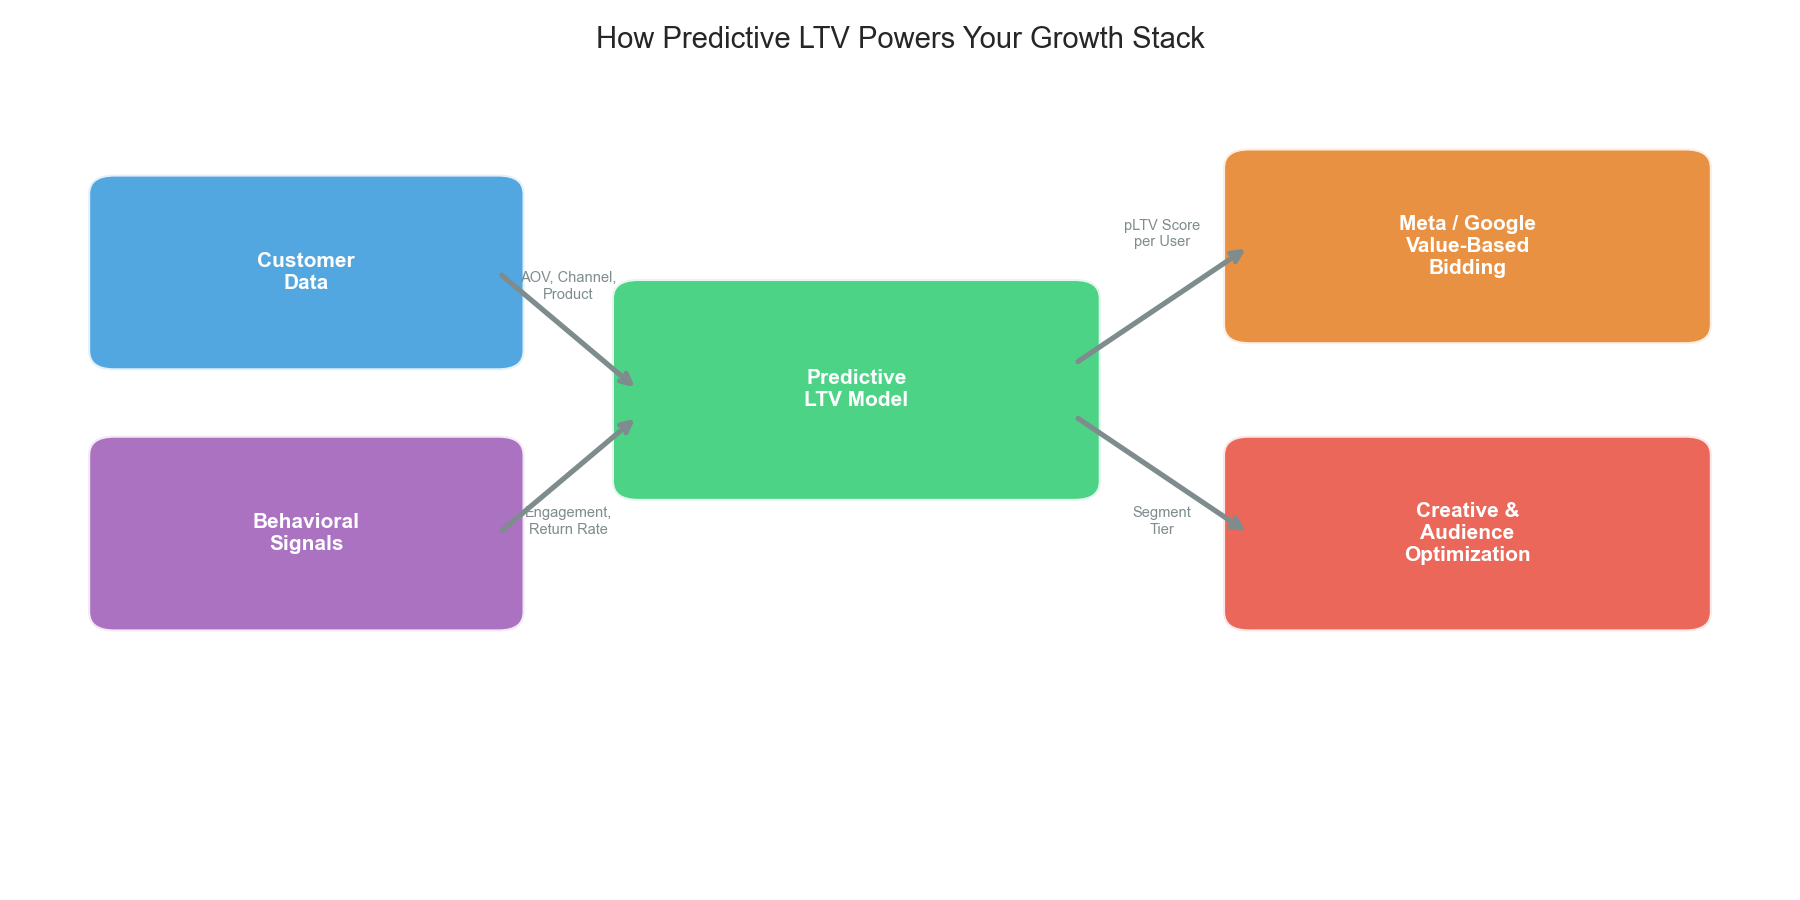
1. Value-Based Bidding (VBB) on Meta & Google
This is the single highest-ROI application of pLTV.
Instead of telling Meta "optimize for purchases" (which finds cheap, one-time buyers), you tell Meta "optimize for this value" — and you pass your pLTV score as the conversion value.
Both Meta (via Conversions API + Value Optimization) and Google (via Value-Based Bidding) support this natively. The result: the algorithm stops chasing cheap conversions and starts finding customers who will stick around.
Real-world results:
- Curology increased ROAS by 16% by feeding real-time pLTV scores into Google's Value-Based Bidding [8].
- Good Clean Love reallocated a third of its marketing budget toward predicted high-value customers, achieving significantly increased ROAS [8].
- Companies using pLTV-based bidding via platforms like Churney have reported ROAS improvements ranging from +12% to +190% [9].
Critical detail: Timing matters. Your pLTV score must reach the ad platform within minutes to hours of the conversion event. A prediction delivered 7+ days later has almost zero impact on the bidding algorithm [10].
2. Creative & Audience Optimization
If you know which types of customers have high pLTV, you can reverse-engineer your creative strategy.
Example: Your pLTV model reveals that customers who buy the "Starter Bundle" have 3x the LTV of customers who buy a single item on discount. What do you do?
- You stop running "50% off single items" ads.
- You start running "Starter Bundle" ads, even if Day 1 ROAS looks lower.
- You build lookalike audiences from your high-pLTV customers, not from "all purchasers."
This is how pLTV moves upstream from a finance metric to a creative strategy.
3. Retention & Lifecycle Triggers
Not every customer needs the same retention treatment.
- High pLTV + Low Engagement: Red alert. This is a valuable customer slipping away. Trigger a personalized win-back sequence immediately.
- Low pLTV + High Engagement: This customer is active but not valuable. Don't overspend on retention. Standard flows are fine.
- High pLTV + High Engagement: Your VIPs. Surprise and delight them. Referral programs. Early access. White-glove support.
How NOT to Use Predictive LTV
Just as important as knowing how to use pLTV is knowing when it can mislead you.
Don't use pLTV as gospel on Day 1. At Day 1, your model is ~45% accurate. That's better than nothing, but it's not a basis for betting the company. Use Day 1 pLTV for directional decisions (bid higher vs. lower), not for exact dollar-level financial planning.
Don't use pLTV to justify infinite CAC. "Our pLTV is $500, so we can spend $200 on acquisition!" Maybe. But only if your cash flow can survive the payback period. A startup with 6 months of runway cannot afford 12-month payback, no matter how beautiful the pLTV model looks.
Don't forget to retrain. A pLTV model trained in January and never updated will decay by summer. Customer behavior shifts with seasons, product changes, and market conditions. Retrain at least quarterly.
Don't optimize pLTV in isolation. A team obsessed with pLTV can start ignoring volume. You might have the highest LTV customers in the world — but only 50 of them. pLTV must always be balanced against scale and total addressable market.
Who Does This Well?
Spotify uses ML-powered LTV models to predict which free-tier users are most likely to convert to paid subscribers, and targets them with personalized upgrade offers at precisely the right moment [11].
Stitch Fix built their entire business model around predictive customer value. Their algorithms predict not just what a customer will buy, but how much they'll spend over time, informing everything from inventory purchasing to stylist assignments.
Dollar Shave Club (pre-Unilever acquisition) was one of the early DTC brands to realize that their cheapest acquisition channel (viral video) also produced their highest-LTV customers — a counterintuitive insight that only pLTV analysis could surface.
At Scentbird, we learned many of these lessons the hard way. We discovered that customers acquired through influencer partnerships had 2x the LTV of customers acquired through discount-driven Facebook ads — but the Facebook cohort looked better on Day 1 ROAS. Without pLTV, we would have kept pouring money into the wrong channel. This experience is a big part of why we built Finsi — to give every subscription and e-commerce company access to the same predictive intelligence, without needing to build a data science team from scratch.
Chapter 4: The CFO-CMO Disconnect — When LTV Meets the P&L
By now you have the toolkit: cohort-based Margin LTV (Chapter 2), a Payback Period target (Chapter 1), and maybe a pLTV model feeding your bids (Chapter 3).
Your marketing team is excited.
Then your CFO looks at the numbers and says: "We're losing money."
You say: "But our LTV:CAC is 3:1!"
They say: "That's great. We still can't make payroll in March."
This is the most common and most dangerous disconnect in growth companies. Marketing and Finance are looking at the same customers and seeing completely different stories. This chapter is about bridging that gap — because if your CMO and CFO aren't on the same page, nothing else in this series matters.
Same Cohort, Two Different Stories
Let's take a single cohort — 1,000 customers acquired in January — and look at it through two lenses.
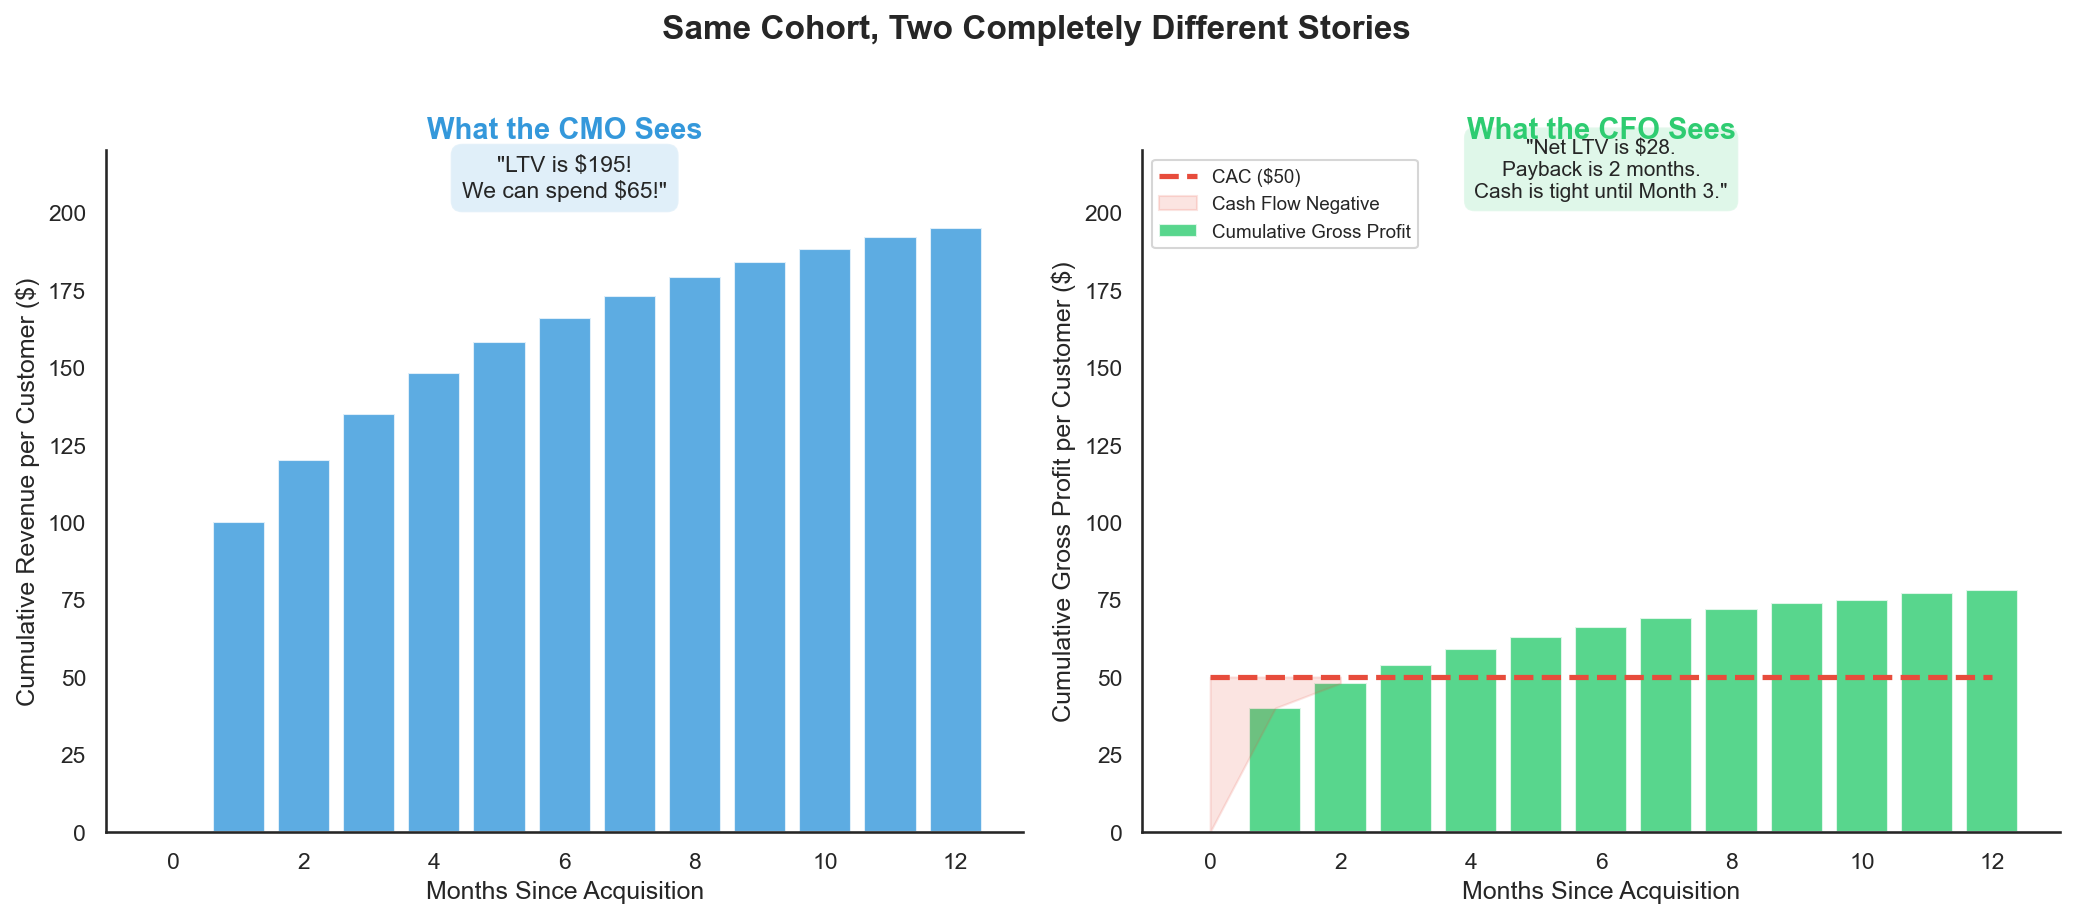
Marketing reports "$195 LTV" and a nearly 4:1 ratio. Finance reports "$28 net contribution" and a 60-day cash hole.
Both are correct. Both are looking at real numbers. The problem isn't the math — it's that marketing stops at Revenue and finance starts at Gross Profit. There are six layers between those two numbers, and every miscommunication lives there.
The Unit Economics Waterfall
This is the framework that closes the gap. It takes one customer through every P&L layer, from the top-line number marketing loves to the bottom-line number finance needs:
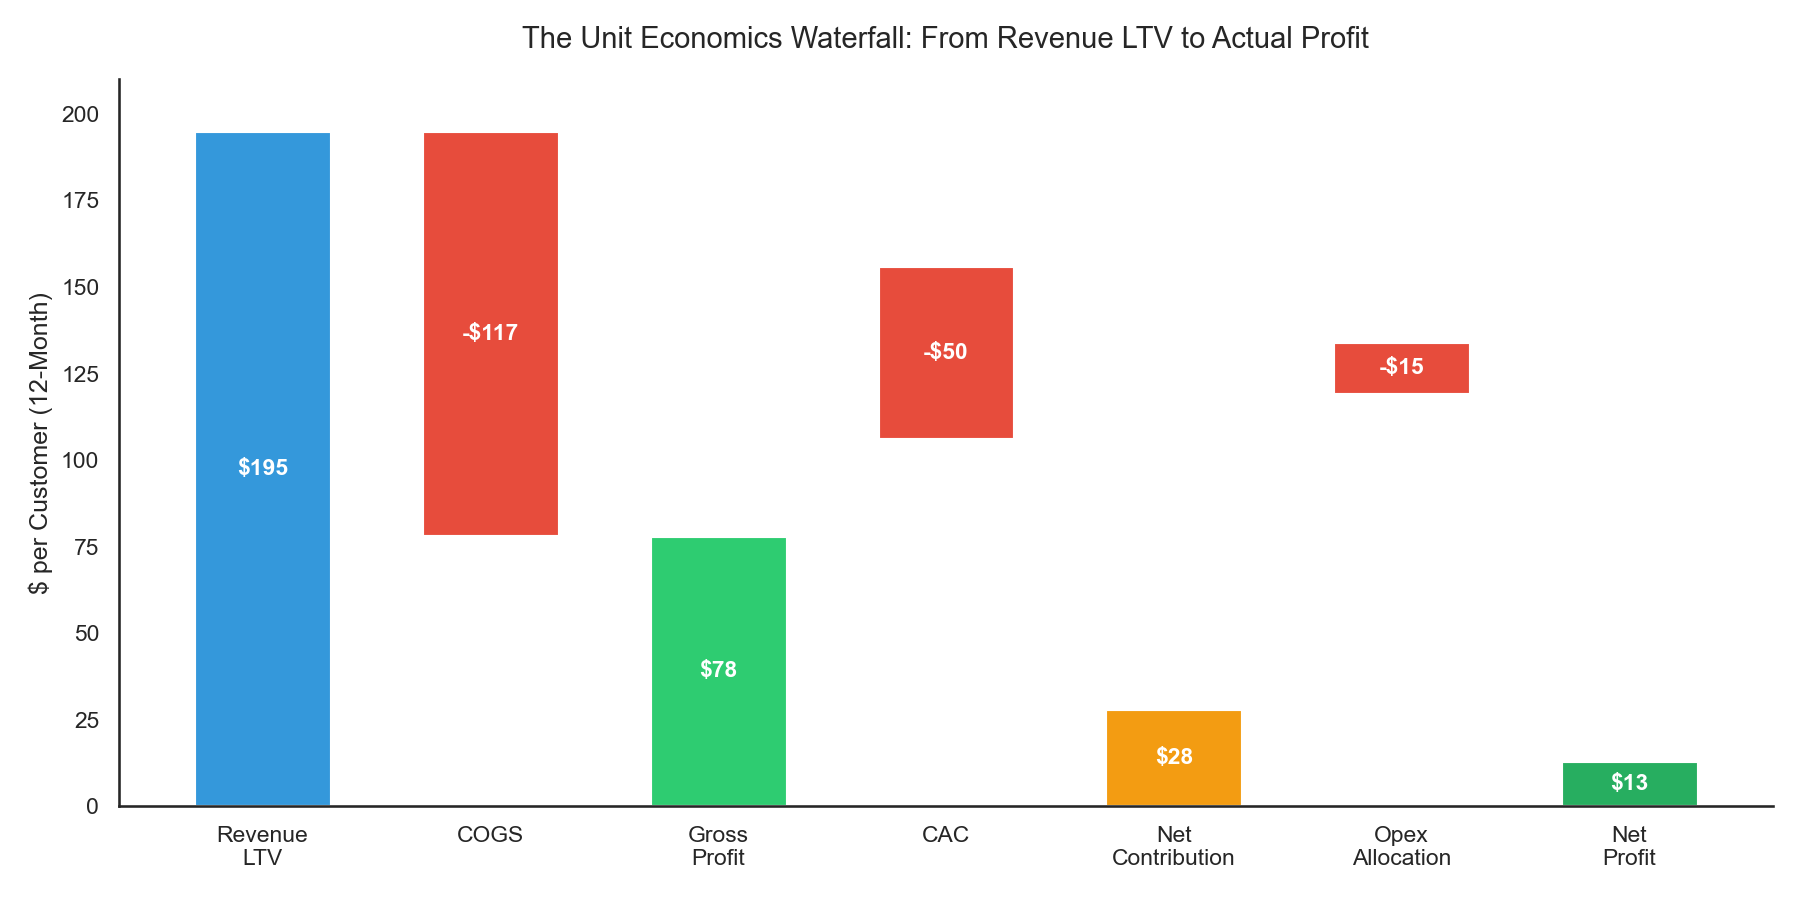
- Revenue LTV ($195): What marketing reports.
- COGS (-$117): Product, shipping, packaging, payment processing.
- Gross Profit ($78): The Margin LTV we defined in Chapter 2.
- CAC (-$50): Fully loaded — not just ad spend but also team salaries, agency fees, tools, and creative production. (Most companies undercount CAC by 30-50% because they only include media spend.)
- Net Contribution ($28): What the customer actually contributes after acquisition and COGS.
- Opex Allocation (-$15): The customer's share of fixed costs — engineering, office, legal, support infrastructure.
- Net Profit ($13): What's actually left. Per customer.
Marketing says "$195." Finance says "$13." The Waterfall shows exactly where the $182 goes.
The Cash Flow Timing Problem
There is a second, subtler disconnect that the Waterfall alone doesn't solve: timing.
We covered Payback Period in Chapter 1 as a strategic concept. Here is what it looks like on a cash flow statement:
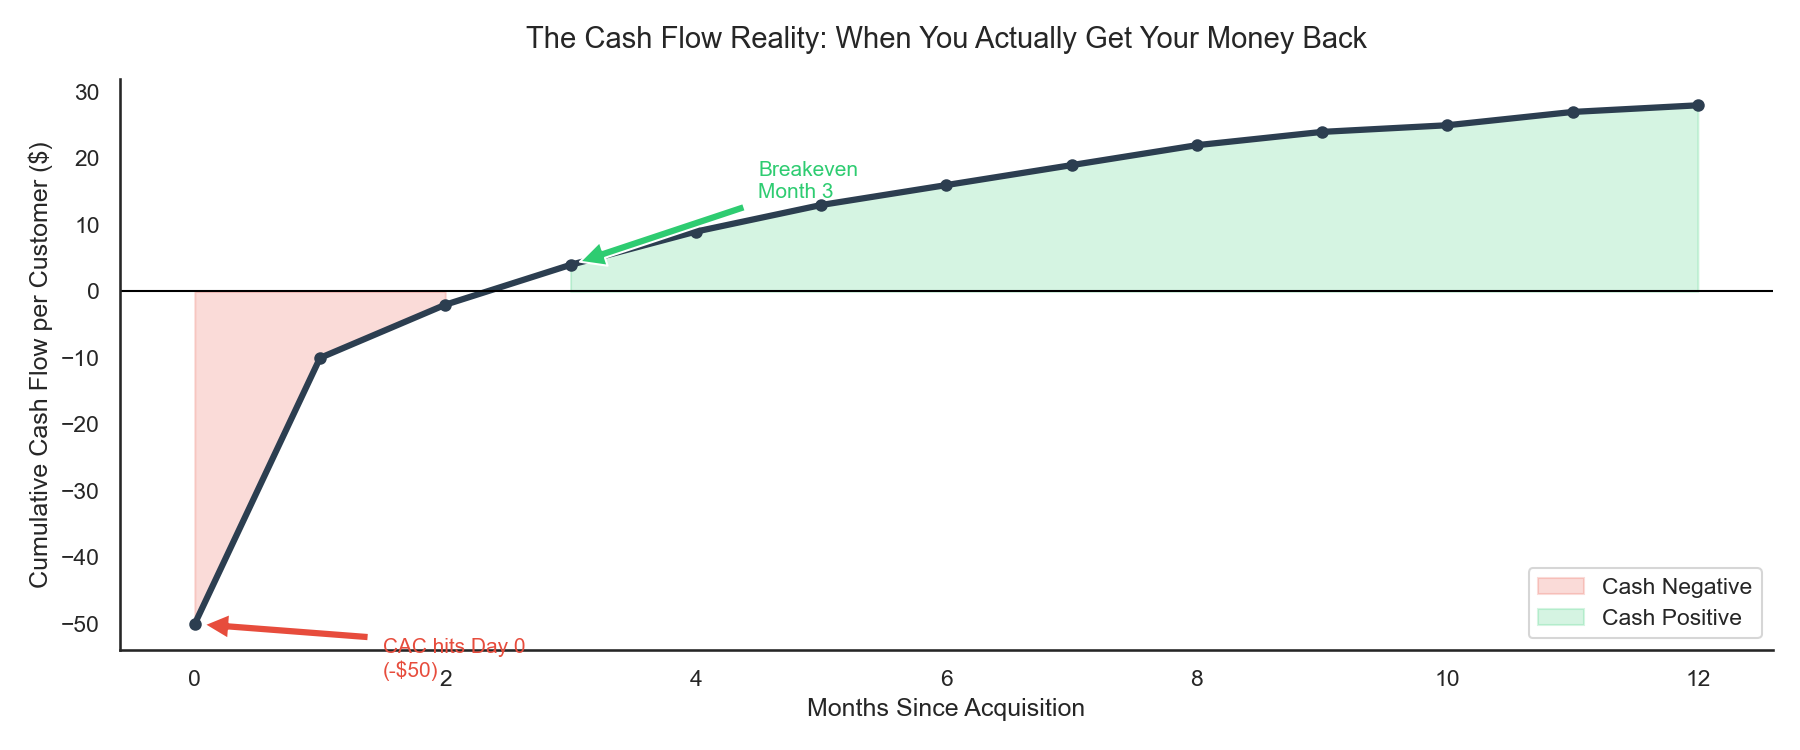
You spend $50,000 to acquire 1,000 customers on Day 1. But revenue trickles in over 12 months. You don't break even on that cohort until Month 2. And you don't see the full $28 net contribution until Month 12.
Now multiply that by 12 months of continuous acquisition. You are always financing the next cohort with cash you haven't collected yet.
This is why fast-growing companies with positive unit economics still run out of money. Marketing sees a healthy ratio and says "scale faster." Finance sees a cash gap and says "slow down." They are both right — they're just looking at different time horizons.
The 5-Number Alignment Framework
Every month, marketing and finance should sit down and agree on exactly five numbers. Not dashboards. Not decks. Five numbers.
1. Gross Margin LTV — Not Revenue LTV. This was established in Chapter 2, but many marketing teams still report top-line. Force the switch.
2. Fully Loaded CAC — Ad spend plus team salaries, agency fees, tools, and creative production. The true cost of acquiring a customer.
3. Net Contribution — Gross Margin LTV - Fully Loaded CAC. This is what the business actually earns per customer. If it's negative, you are subsidizing growth with investor money.
4. Payback Period — How many months until cumulative margin covers CAC. This is the CFO's most important number because it determines how much cash the company needs to float growth.
5. Channel-Level LTV:CAC — Not blended. Per channel. Your Google Branded search might be 5:1 while TikTok prospecting is 1.5:1. Blending hides the truth. Finance needs to know which channels are subsidizing which.
The Budget Conversation (Before and After)
Before the framework: CMO: "I need $2M for Q2. Our LTV:CAC is 3:1, so every dollar returns three." CFO: "Last quarter you spent $1.5M and our gross margin didn't improve proportionally. Where's the money going?" Result: Fight. Delay. Distrust.
After the framework: CMO: "For Q2, I'm requesting $2M. Based on our cohort data, this will acquire approximately 40,000 customers at a fully loaded CAC of $50. Gross Margin LTV is $78. Net contribution is $28 per customer, totaling $1.12M. Payback is 2 months, meaning we'll need to float $2M for 60 days before the first cohort breaks even. By end of Q2, the cash flow from Q1 cohorts will fund Q2 acquisition." Result: Approval. Shared accountability. Clear cash flow expectations.
Same request. Different language. Different outcome.
The Monthly Unit Economics Review
The best-run companies I've seen hold one 30-minute meeting per month between marketing and finance:
- Cohort Tracking: How are the last 3 months of cohorts performing vs. the five numbers?
- Channel Shifts: Are any channels getting more expensive? Should we reallocate?
- Cash Flow Forecast: Based on current acquisition velocity and payback curves, when does the company need additional capital?
- Model Accuracy (if using pLTV from Chapter 3): Are predictions holding up? Do we need to adjust bids?
This meeting prevents 90% of CMO-CFO arguments. It forces both teams to operate from the same source of truth — not "marketing's dashboard" or "finance's spreadsheet," but one shared model.
At Scentbird, implementing this cadence fundamentally changed how we made decisions. Instead of silos — one team optimizing for top-line growth, the other managing cash — we had a shared vocabulary. Tools like Finsi can automate much of this, generating cohort-level Waterfall breakdowns and cash flow projections in real time rather than relying on quarterly Excel exercises.
Conclusion
Across these four chapters, we've traced a complete path:
- Chapter 1: ROAS is fragile. The "Profit Squeeze" shows that transactional models break under minor cost pressure. Retention is the mathematical escape route.
- Chapter 2: Calculating LTV correctly — by cohort, on margin, not averages — is the foundation. Without it, every decision downstream is built on sand.
- Chapter 3: Predictive LTV is the multiplier. It lets you act on the future instead of reacting to the past. It powers value-based bidding, creative strategy, and intelligent retention.
- Chapter 4: None of it matters if marketing and finance aren't aligned. The Unit Economics Waterfall and the five shared numbers bridge the gap between "LTV is $195!" and "We can't make payroll."
The companies that win in 2026 will not be the ones who spend the most on ads. They will be the ones where every team — marketing, finance, product — operates from the same unit economics model and makes decisions at the speed the market demands.
Stop renting your growth. Start building it — together.
References
- Artisan Growth Strategies. (2025). "Customer Acquisition Vs Retention Costs: Statistics & Trends"
- Adventure PPC. "Baketivity YoY Growth Soars after Analyzing Customer LTV's"
- LayerFive. "How a Premium DTC Skincare Brand Scaled to $18M ARR"
- Propel. (2025). "Customer Retention Statistics Report 2025"
- Taboola. "Beyond ROAS: Why LTV is the Metric That Matters"
- AppsFlyer. "Pitfalls of Modeling LTV and How to Overcome Them"
- Tamaki, R. "Forecasting Customer Lifetime Value — Challenges"
- Ocurate. "Increase Google ROAS with Real-time LTV for Value-Based Bidding"
- Churney. "Case Studies on Predictive LTV Bidding"
- Angler. "Cracking Predictive LTV-Based Bidding on Meta and Google Ads"
- Marketing AI Institute. "How Spotify Uses AI"