
How to Calculate Customer Retention Rate (Formula, Benchmarks, and Common Mistakes)
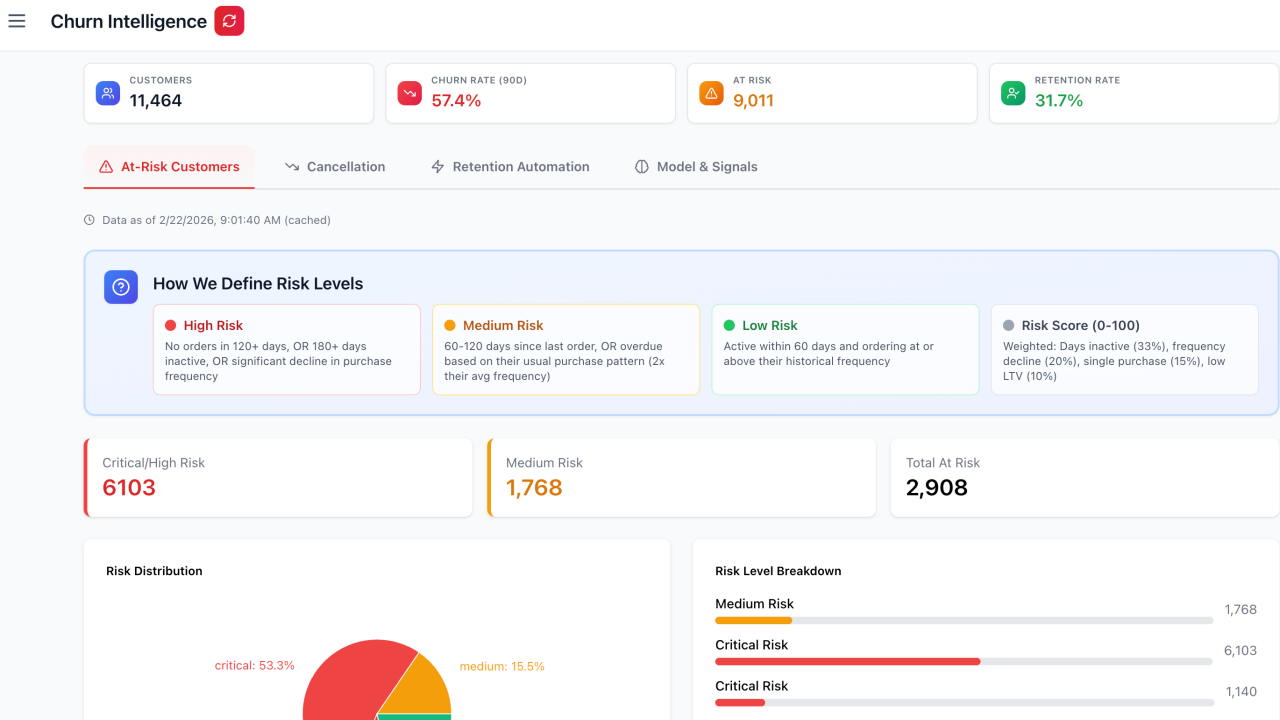
Customer retention rate measures the percentage of customers who continue to do business with a brand over a defined period. The standard formula is: CRR = ((Customers at end of period - New customers acquired during period) / Customers at start of period) × 100. For a brand that started the month with 1,000 customers, acquired 300 new ones, and ended with 1,150, the retention rate is ((1,150 - 300) / 1,000) × 100, or 85%.
That single sentence is what most people search for when they look up the retention rate formula. The rest of this article exists because the formula in isolation produces the wrong answer for most e-commerce brands — three specific calculation mistakes distort the number badly, the benchmark depends heavily on vertical, and serious retention analysis uses cohort tracking rather than period-level rates.
The formula in detail
The mechanical inputs:
- Customers at start of period (S) — the count of active customers when the measurement window opens.
- Customers at end of period (E) — the count when the window closes.
- New customers acquired during period (N) — anyone who made their first purchase or signed up during the window.
The retention rate is then:
`` CRR = ((E - N) / S) × 100 ``
The subtraction of new customers is what most people omit, and it is the most common source of inflated retention numbers. Without subtracting new acquisitions, a brand that grows fast can show 95% retention while losing 25% of its starting cohort — the retention metric is being papered over by acquisition.
A concrete example using both methods. A brand starts January with 1,000 customers. Through January it acquires 400 new customers. At the end of January it has 1,250 active customers. The correct retention rate is ((1,250 - 400) / 1,000) × 100 = 85%. The incorrect calculation (1,250 / 1,000) × 100 = 125% — which is nonsense as a retention rate, but it is the calculation some platforms still default to when retention is approximated by total customer count.
What "customer" means depends on the business model
For a one-time-purchase ecommerce brand, "active customer" usually means someone who has bought in the last 90 or 180 days. The window depends on typical repeat purchase cadence. A brand selling protein powder (typical reorder cycle: 30-60 days) should use a 90-day active window. A brand selling mattresses (typical reorder cycle: 5-7 years) cannot use retention rate as a primary metric at all — repeat-purchase analytics matter more than retention because most customers are not eligible to be retained on any reasonable timescale.
For a subscription brand, "active customer" is a subscriber on an active plan. The complexity is the eligible-to-churn cohort issue addressed in the second main section below.
For a hybrid brand (a Shopify store with both one-time orders and a subscription option), calculate separately for the subscription and one-time segments, then report both. Aggregating them masks the underlying dynamics.
The three mistakes that distort the number
Mistake one: not subtracting new customers. Covered above. Inflates retention proportional to growth rate.
Mistake two: using the wrong denominator for subscription brands. A subscriber locked into a 6-month plan cannot cancel in month 3. If they cannot cancel, they should not be in the denominator for month 3 churn. The correct subscription retention rate is calculated on the eligible-to-churn cohort: subscribers whose renewal date falls within the measurement period. One subscription brand running this analysis found that their "12% monthly churn" was actually 6% on the eligible cohort — they had been over-investing in retention software while under-investing in onboarding because they misread the problem.
Mistake three: using revenue or order count as a proxy for customer retention. A common shortcut is to measure repeat revenue or repeat order count instead of repeat customers. The problem is that one bulk-buying corporate customer or one influencer order can swamp the signal. A more accurate proxy when full customer data is hard to access: trailing-12-week unique customer count. It smooths the noise and still tracks the underlying behavior.
E-commerce retention benchmarks by vertical (2026)
| Vertical | Monthly retention (median) | Top decile |
|---|---|---|
| Subscription boxes | 88% | 92%+ |
| Beauty / personal care | 89% | 93%+ |
| Health / supplements | 85% | 90%+ |
| Food / beverage | 85% | 89%+ |
| Apparel | 75% | 82%+ |
| Electronics / hard goods | 70% | 78%+ |
These benchmarks reference retention benchmark research updated for 2026. Two cautions when applying them: average order value matters (a brand selling $200 protein subscriptions has different retention dynamics than one selling $25), and the benchmark assumes the correct calculation methodology — many published "industry retention rates" are calculated incorrectly and look better than they should.
Why cohort retention is the better tool
A single retention percentage for a month tells you whether the brand is shrinking, holding, or growing — useful for the executive summary, insufficient for any operational decision.
Cohort retention groups customers by acquisition month and tracks each cohort separately. The output is a triangle of percentages: each row is an acquisition cohort, each column is months since acquisition. Reading the rows reveals retention behavior over the customer lifecycle. Reading the columns reveals whether retention is improving or deteriorating as the brand acquires newer customers.
This matters because most retention problems are concentrated in specific cohorts. A brand whose June-acquired customers retain at 95% in month 1 but whose September-acquired customers retain at 78% in month 1 has an acquisition-quality problem in September, not a retention-system problem. A single retention rate would not surface this — it would average everything and show "84%."
Cohort retention also lets you project forward. Mature cohorts (those with 12+ months of data) show what the long-term retention curve looks like. Newer cohorts can be projected against that curve to estimate their lifetime value before they have lived long enough to prove it. This predictive LTV approach drives most modern customer acquisition decisions — bidding higher on the channels producing cohorts whose projected curve is favorable.
For deeper coverage of cohort analysis methodology, see the ecommerce cohort analysis guide.
How retention rate feeds the bigger picture
Customer retention rate is one of three core e-commerce health metrics, alongside customer acquisition cost (CAC) and customer lifetime value (LTV). The relationship:
- Retention drives LTV. A 1-point improvement in monthly retention compounds to a meaningful LTV lift over the customer lifetime. For a subscription brand at 90% monthly retention with $30 monthly contribution margin, moving to 92% retention adds roughly $40 in LTV per customer.
- LTV bounds CAC. A healthy LTV:CAC ratio is 3:1 or higher (see the LTV:CAC ratio guide). Higher LTV through better retention raises the CAC ceiling, which lets the brand bid more aggressively on paid acquisition without sacrificing unit economics.
- CAC drives growth rate. Brands with higher allowable CAC can scale acquisition faster.
The chain runs: retention → LTV → CAC ceiling → growth rate. This is why retention is often called the most leveraged metric in e-commerce — small improvements compound into materially different business outcomes.
Acting on retention rate
Knowing the number is the easy part. Improving it is the work. The interventions that actually move retention rate, in rough order of impact:
- Reduce involuntary churn. Failed payments cause 20-40% of total subscription churn. Implementing smart dunning typically recovers 55-80% of failed payments versus 15-25% for basic retry logic. This is usually the fastest 30-60 day win.
- Fix the first-purchase-to-second-purchase gap. Most DTC brands retain only 25-30% of first-time buyers for a second purchase. Post-purchase welcome sequences, replenishment reminders, and product-fit emails can lift this 5-15 points within 90 days.
- Segment-aware winback campaigns. Treating all at-risk customers identically wastes effort. Segment by churn-risk score, then deploy different offers — discount for price-sensitive segments, pause options for usage concerns, content for engagement-driven segments. See the winback campaign guide.
- Subscription cancellation flows. A well-designed cancellation flow with reason-matched retention offers saves 15-30% of subscribers who reach the cancel button. See subscription cancel flow best practices.
- VIP and tiered loyalty. Customers who reach VIP status spend 2-5x more annually with retention rates above 80%. This is a longer-build initiative but the LTV impact is significant.
The brands that compound retention improvements over a year typically lift LTV by 25-50% — which translates into the ability to spend 25-50% more on acquisition profitably, which translates into a structural growth advantage over competitors who never made retention a priority.
Finsi calculates retention rate correctly (including cohort-segmented and eligible-to-churn views), benchmarks the brand against its vertical, and identifies which of the five interventions above is the highest-leverage move at the brand`s current state. Start a free trial to see retention metrics on your data, accurate from day one.
FAQ
What is the customer retention rate formula?
Customer Retention Rate (CRR) = ((Customers at end of period - New customers acquired during period) / Customers at start of period) × 100. The result is a percentage. If a brand started the month with 1,000 customers, acquired 300 new ones, and ended with 1,150, the retention rate is ((1,150 - 300) / 1,000) × 100 = 85%. This formula measures what percentage of the starting cohort was still active at the end of the period.
What is a good customer retention rate for ecommerce?
Monthly retention rates by ecommerce vertical (2026 benchmarks): subscription boxes 85-92%, beauty and personal care 86-92%, health and supplements 82-88%, food and beverage 82-88%, fashion and apparel 70-80%, electronics 65-75%. Brands above 90% monthly retention are in the top decile. Brands below 70% monthly retention typically have a product-market-fit or onboarding problem, not a retention problem.
How is customer retention rate different from churn rate?
They are mathematical complements. Retention Rate + Churn Rate = 100% for the same period. If monthly churn is 8%, monthly retention is 92%. The two metrics describe the same underlying behavior; brands tend to talk about retention when discussing positive outcomes and customer success initiatives, and churn when discussing problems and intervention spending. Operationally there is no difference between optimizing for 92% retention and optimizing for 8% churn.
How do I calculate customer retention rate for a subscription business?
Subscription brands should calculate retention on the eligible-to-churn cohort, not the total subscriber base. If a subscriber locked into a 6-month plan cannot cancel in month 3, they should not be in the denominator for month 3 churn. The correct formula is: Subscription Retention Rate = (Subscribers who renewed at end of cycle / Subscribers eligible to renew at end of cycle) × 100. Brands that use the total subscriber base typically understate their true churn by 30-50%, which leads to under-investing in retention.
What is the difference between customer retention rate and cohort retention?
Customer retention rate is a single percentage for a period. Cohort retention tracks specific groups of customers (typically grouped by acquisition month) and measures what percentage of each group is still active over successive months. Cohort retention reveals patterns that single-period retention hides: whether newer customers retain better than older ones, where the biggest drop-off happens in the customer lifecycle, and how long it takes for retention to stabilize. For serious analysis, cohort retention is the correct tool; single-period retention is a high-level summary.
How often should I calculate customer retention rate?
Calculate monthly retention rate weekly so trends become visible quickly. Calculate cohort retention curves monthly. Review the LTV:CAC ratio (which depends on retention) at least quarterly when making budget decisions. For executive dashboards, present trailing-12-week and trailing-12-month retention together: the short window catches recent changes, the long window provides stability and benchmark comparison.
What are the most common mistakes when calculating customer retention rate?
Three mistakes account for most distorted retention numbers. First: including new customers acquired during the period in the calculation, which inflates the rate (a brand acquiring fast can show 95% retention while actually losing 25% of its base). Second: calculating on the total subscriber base instead of the eligible-to-churn cohort, which understates churn by 30-50% for subscription brands. Third: using order count or revenue as a proxy for retention without accounting for one-time bulk buyers, which creates noise that swamps the signal. The fix is the standard formula in the first FAQ and segmentation by customer behavior.