
Customer Churn Prediction: The Signals, the Model, and the 14-Day Intervention Window
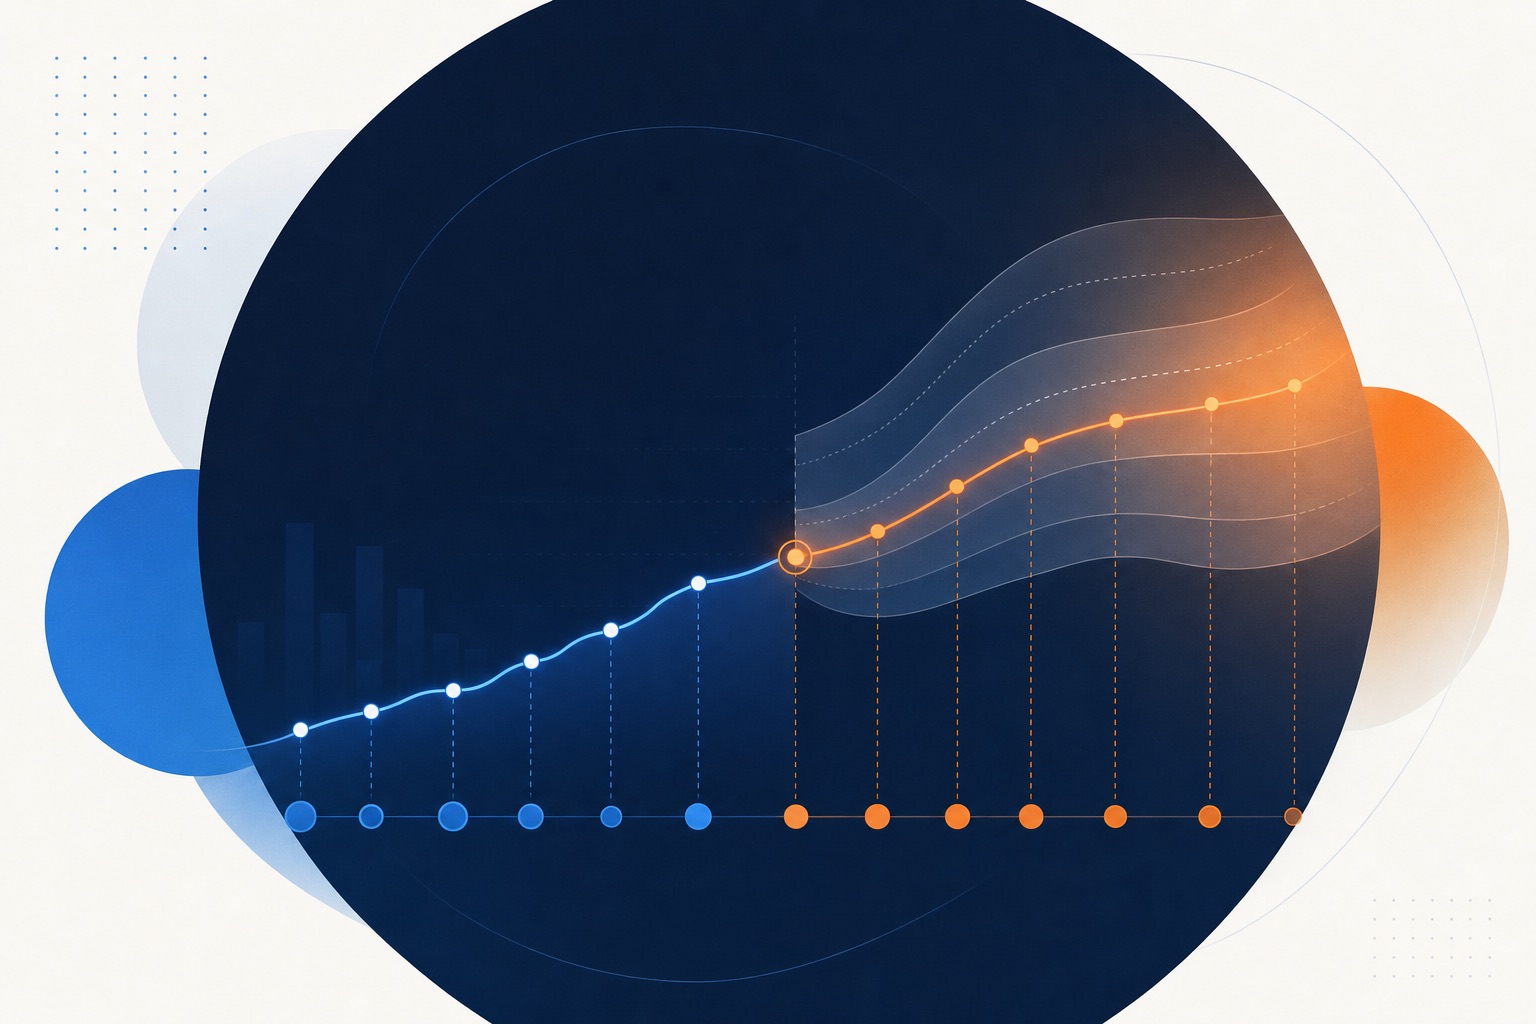
Customer churn prediction scores each active customer on how likely they are to stop buying before they actually cancel, which turns retention from a reaction into an intervention. The distinction that matters most is timing: a churn report tells a brand who already left, while churn prediction flags who is about to, and the intervention window for acting on that signal is roughly 14 days before predicted churn. Miss that window and reactivation costs several times more, because the customer has already disengaged rather than merely started to.
Most brands conflate churn prediction with churn reporting, and the two are opposites in what they enable. Reporting is backward-looking: it measures the rate at which customers have left, useful for benchmarking but useless for saving any specific customer, because by the time a customer appears in a churn report the decision is made. Prediction is forward-looking: it identifies at-risk customers while they can still be retained. A brand with excellent churn reporting and no prediction knows precisely how much it is losing and can do nothing about it.
This guide covers the signals that predict churn, how a churn model turns them into a risk score, why the intervention window is as short as it is, and how prediction differs from the reporting brands often mistake for it.
The signals that predict churn
Churn is preceded by observable changes in behavior, usually weeks before the cancellation itself. A churn model watches for these leading indicators rather than the cancellation.
| Signal | What it indicates |
|---|---|
| Declining purchase frequency | The strongest single predictor; cadence slows before it stops |
| Falling engagement | Email opens, site visits, and app sessions drop ahead of churn |
| Payment failures | Involuntary churn risk; a failed charge often precedes silent loss |
| Support friction | Unresolved tickets and negative sentiment raise risk sharply |
| Reduced order value | Smaller baskets can signal declining commitment |
| Elapsed time since last order | Against the customer normal cadence, not a fixed calendar |
The most important of these is purchase frequency measured against the customer's own baseline, not a global one. A customer who ordered every 30 days and has now gone 45 is showing risk; a customer who always ordered every 60 days is not, at the same 45. Churn prediction that uses a fixed interval for all customers misfires on both ends - flagging healthy slow-cadence buyers and missing fast-cadence ones who have slowed.
How a churn model works
A churn model combines the signals into a single risk score, typically 0 to 100, updated continuously as behavior changes. It is trained on historical data: customers who churned and the behavioral patterns that preceded their churn, against customers who stayed. The model learns which combinations of signals, at which magnitudes, actually precede churn for this specific business, because the patterns differ by category - a supplement brand and an apparel brand have different churn signatures.
The output is not a yes-or-no prediction but a probability, which is what makes it actionable. A customer at risk score 75 is not certain to churn, but is far more likely than one at 30, and a brand can prioritize its retention effort on the highest-risk segment rather than spreading it across the whole base. The score turns retention from a broadcast into a targeted intervention, which is where its economics come from - intervening on the 5% of customers most likely to leave is cheaper and more effective than a campaign to everyone.
Why the window is 14 days
The roughly 14-day intervention window before predicted churn is not arbitrary. It is the span in which a customer has begun to disengage but has not yet made the decision to leave, which is when intervention still changes the outcome.
Act too early and the signal is noise - many customers who slow briefly resume without any intervention, so contacting them wastes effort and can annoy customers who were never going to churn. Act too late, after the customer has mentally cancelled, and intervention becomes reactivation, which is a harder and more expensive problem: the customer has already found a substitute, lost the habit, or emotionally moved on. The window is the interval where the customer is reachable and the decision is still open.
This is why prediction and timing are inseparable. A perfect risk score delivered after the window has closed is worth little, and an intervention fired before the window opens is wasted. The value of churn prediction is not just knowing who is at risk but knowing when to act, and the two together define the intervention.
Prediction versus reporting
The practical test of whether a brand is doing churn prediction or churn reporting is simple: can it name the customers at risk right now, or only the ones who already left. Reporting produces a rate; prediction produces a list. A brand that can only produce a rate is measuring the problem, not solving it.
Building prediction requires joining behavioral signals - purchase cadence, engagement, payment health, support sentiment - into a per-customer score, which most subscription and analytics reporting does not do because it aggregates to a rate rather than scoring individuals. The reporting most brands have tells them churn is 6% this month; it does not tell them which customers make up next month's 6% while there is still time to keep them.
Finsi scores churn risk per customer from purchase, engagement, and payment data, and flags the intervention window - turning the churn rate a brand can already see into the at-risk list it needs to act on.
Related reading: how to reduce customer churn covers acting on the prediction, and customer health score covers the scoring model in more depth.
Andrei Rebrov is Co-CEO of Finsi, where he builds AI-powered analytics for subscription and DTC e-commerce. He writes on subscription economics, LTV modeling, cohort analysis, and retention metrics.