
Customer Churn: Definition, How to Measure It, and What to Do About It (2026 Guide)
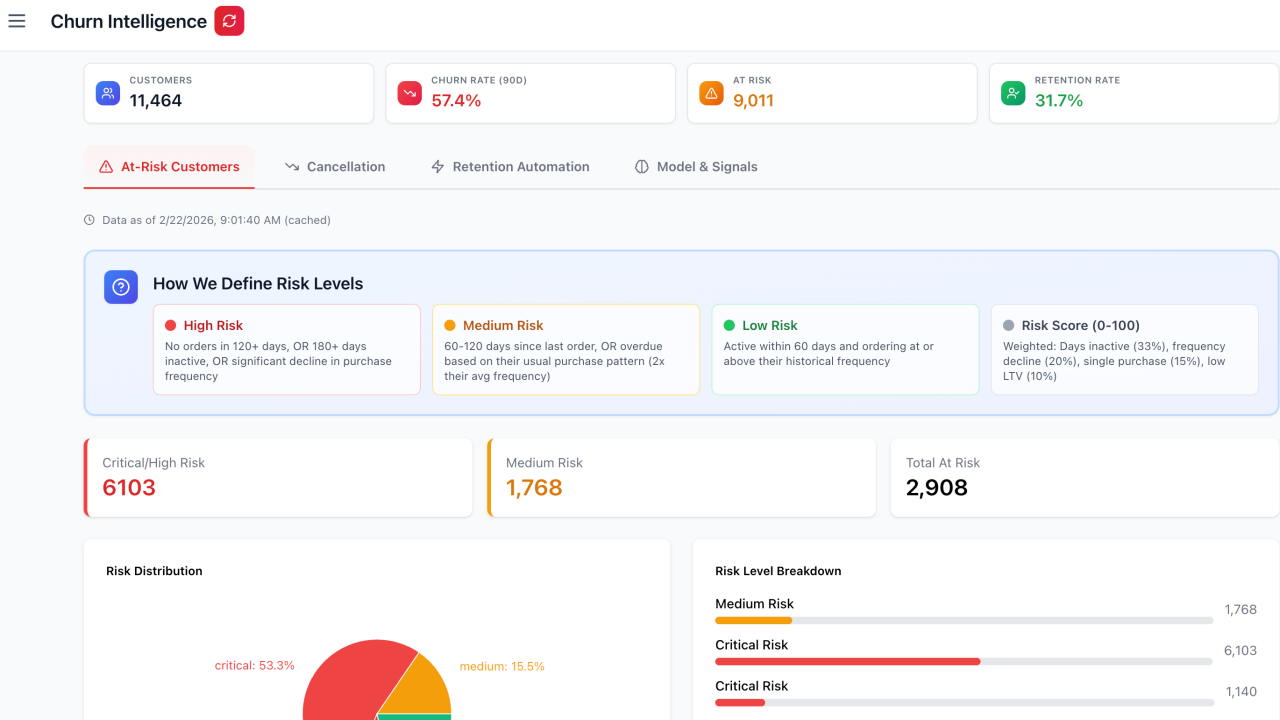
Customer churn is when customers stop doing business with a brand. For subscription businesses, churn is the cancellation of a subscription or the lapse of one due to failed payments. For one-time-purchase ecommerce, churn means a customer who has not bought again within a typical reorder window. Customer Churn Rate + Customer Retention Rate = 100% for the same period.
This is the simple definition. The complete picture has more shape — churn splits into voluntary and involuntary categories with completely different solutions, the calculation methodology matters as much as the underlying number, and the interventions that move churn have different impact at different stages of the customer lifecycle.
What "customer" means in churn
The definition of churn depends on what kind of customer relationship the brand has.
For subscription brands, a customer is a subscriber on an active plan. Churn happens when the plan ends — either through cancellation (voluntary) or through payment failure that was not recovered (involuntary). The eligible-to-churn cohort matters: a subscriber locked into a 6-month plan in month 3 has not had the option to churn yet and should not be in the churn denominator until their renewal point arrives.
For one-time-purchase ecommerce brands, the definition is fuzzier. A customer is "active" if they have purchased within some recent window. Brands selling consumables on a 60-day reorder cycle typically use a 90-day or 180-day window to define active customers. Brands selling durable goods (mattresses, appliances) cannot use churn meaningfully — repeat purchase rate is the more useful metric.
For hybrid brands (a Shopify store with both subscription and one-time options), calculate churn separately for each customer segment. Aggregating them masks the underlying dynamics — a subscription churn problem can be hidden by strong one-time-purchase repeat rates, or vice versa.
The churn rate formula in detail
The standard formula is straightforward but the application is where most mistakes happen:
`` Customer Churn Rate = (Customers Lost During Period / Customers at Start of Period) × 100 ``
A brand that started January with 1,000 subscribers and lost 80 of them has 8% monthly churn. Simple.
The complications:
Denominator selection. For subscriptions, use the eligible-to-churn cohort, not the total subscriber base. A subscriber on a locked-in 6-month plan cannot cancel in month 3. Including them in the month 3 churn denominator understates true churn. One subscription brand running this analysis found their 12% reported monthly churn was actually 6% on the eligible cohort — they had been over-investing in retention software while under-investing in onboarding because the metric was lying to them.
Numerator definition. "Customers lost" can mean cancellations only, or cancellations plus involuntary churn from payment failures, or cancellations plus pauses plus downgrades. The right definition depends on the decision the metric drives. For predicting next month`s revenue, all three matter. For evaluating cancellation-flow effectiveness, only cancellations matter.
Period length. Monthly churn is the standard for most subscription analyses. Annual churn is useful for benchmarking against industry data but obscures intra-year patterns. Weekly churn is too noisy for most brands but useful during major changes (pricing tests, product launches) to see effects quickly.
Voluntary vs involuntary churn — the most important split
Voluntary churn happens when customers actively cancel. Reasons vary: too expensive, not using enough, switching to a competitor, product fit issues, financial constraints. The cancellation surveys most brands run produce stated reasons that often differ from actual underlying reasons.
Involuntary churn happens when payments fail and recovery does not succeed. Expired credit cards, insufficient funds, bank declines, network errors. The customer did not choose to leave — they just stopped paying mechanically.
The split matters because the interventions are completely different:
| Type | Share | Primary intervention |
|---|---|---|
| Voluntary | 60-75% | Cancellation flows, retention offers, product improvement |
| Involuntary | 25-40% | Smart dunning, payment retry optimization, card updater services |
For most subscription brands, the involuntary slice is the fastest win. Implementing AI-powered dunning can recover 55-80% of failed payments versus 15-25% for basic retry logic — typically a 30-60 day implementation that returns 30-50% more recovered revenue.
The voluntary slice is bigger but the interventions take longer to compound. Cancellation flow optimization saves 15-30% of customers who initiate cancellation. Segment-aware winback campaigns reactivate 5-15% of cancelled customers within 60 days. VIP and loyalty programs compound over 6-12 months. See the churn reduction playbook for the detailed intervention sequence.
Churn benchmarks by industry
| Vertical | Monthly churn (median) | Top quartile |
|---|---|---|
| Subscription boxes | 12% | < 8% |
| Beauty / personal care | 11% | < 8% |
| Health / supplements | 14% | < 10% |
| Food / beverage | 15% | < 10% |
| Fashion subscriptions | 18% | < 14% |
| SaaS (consumer) | 5% | < 3% |
| SaaS (B2B) | 2-3% | < 1.5% |
The vertical mix matters because product economics differ. Subscription boxes have higher churn because the value-per-shipment is uneven; SaaS has lower churn because switching costs accumulate over time. Comparing your brand to vertical benchmarks is informative; comparing across verticals is misleading.
Trend matters more than the absolute number. A brand at 10% monthly churn that has been improving for six months is in better shape than a brand at 6% churn that has been getting worse. Investor and finance reporting tends to focus on the absolute number; operational growth decisions should focus on the trend.
The compounding effect
Monthly churn compounds badly. A "modest" 5% monthly churn compounds to 46% annual churn — nearly half the subscriber base turns over each year. This is the math that makes small churn improvements so leveraged.
| Monthly churn | Annual churn | What it means |
|---|---|---|
| 2% | 22% | Healthy SaaS retention |
| 5% | 46% | Subscription box healthy |
| 8% | 63% | Average subscription |
| 12% | 78% | Concerning but recoverable |
| 18% | 89% | Product-market fit problem |
Moving from 12% to 8% monthly churn (a 4-point improvement) shifts annual churn from 78% to 63% — a 15-point swing in how much of the customer base needs to be replaced through acquisition every year. For a brand spending heavily on acquisition, this directly determines whether unit economics work.
What actually moves churn
The five interventions ranked by typical impact for ecommerce subscription brands:
- Smart dunning for involuntary churn. Fastest win. Implementation in 2-4 weeks. Recovers 30-50% more failed-payment revenue. Addresses 25-40% of total churn.
- Post-purchase / post-signup onboarding to fix the first-window dropoff. Most DTC brands retain only 25-30% of first-time buyers for a second purchase; this can be lifted 5-15 points with welcome sequences, replenishment reminders, and product-fit education.
- Segment-aware winback matched to cancellation reason. Different segments need different offers — discount for price-sensitive, pause options for usage concerns, content for engagement-driven. See the winback campaign guide.
- Subscription cancellation flow optimization. Reason-matched retention offers, pause and downgrade options, human-touch for high-value subscribers. Saves 15-30% of customers who reach the cancel button.
- VIP and tiered loyalty. Longer build, but customers who reach VIP status spend 2-5x more annually with retention rates above 80%.
Where churn fits in the broader analytics picture
Customer churn is one of three core ecommerce health metrics, alongside customer acquisition cost (CAC) and customer lifetime value (LTV). The relationship:
- Lower churn → higher LTV (more revenue per customer).
- Higher LTV → higher CAC ceiling (can spend more to acquire profitably).
- Higher CAC ceiling → faster growth (can bid more aggressively on paid acquisition).
Improving churn improves the whole chain. The brands that grow fastest in 2026 are not the ones with the lowest CAC — they are the ones with the lowest churn, which translates into the highest CAC ceiling, which enables aggressive acquisition.
For the formula and the cohort retention methodology that produces more reliable churn measurements than period-level rates, see the customer retention rate guide. For the playbook of churn interventions, see the churn reduction playbook.
Finsi`s retention intelligence platform calculates churn correctly (eligible-to-churn cohorts, voluntary vs involuntary splits), predicts which subscribers are likely to churn next, and runs the interventions that prevent it. Start a free trial to see your accurate churn picture and which interventions would deliver the biggest LTV lift.
FAQ
What is customer churn?
Customer churn is the loss of customers over a defined period. For one-time-purchase ecommerce brands, churn means a customer who has not bought again within a typical reorder window (often 90 or 180 days). For subscription brands, churn means a subscriber who has cancelled or whose subscription has lapsed due to failed payments. Churn is the inverse of retention — Customer Churn Rate + Customer Retention Rate = 100%.
What does churn mean in business?
In business contexts, churn refers to customers leaving — whether that means cancelling a subscription, not making a repeat purchase within an expected window, or otherwise ending the customer relationship. Churn is one of the three core metrics of customer economics alongside customer acquisition cost (CAC) and customer lifetime value (LTV); the three together determine whether a business is sustainable. High churn means high LTV is impossible, which means high CAC is impossible, which constrains growth.
What is the formula for customer churn rate?
Customer Churn Rate = (Customers Lost During Period / Customers at Start of Period) × 100. If a brand started January with 1,000 subscribers and lost 80 of them, the monthly churn rate is 8%. For subscription brands, the formula should be applied to the eligible-to-churn cohort (subscribers whose plan can actually end in the period) rather than the total subscriber base — applying it to the total base understates true churn by 30-50%.
What is the difference between voluntary and involuntary churn?
Voluntary churn is when customers actively decide to cancel — usually because of dissatisfaction, cost, or changing needs. Involuntary churn is when customers leave because their payment failed — expired cards, insufficient funds, bank declines — and recovery did not succeed. Voluntary churn is 60-75% of total subscription churn; involuntary is 25-40%. They require completely different solutions: voluntary churn needs cancellation flows, retention offers, and product improvements; involuntary churn needs smart dunning and payment retry optimization.
What is a good customer churn rate for ecommerce?
Monthly churn rate benchmarks vary by vertical. Subscription boxes: 8-15% monthly churn (top quartile under 8%). Beauty and personal care: 8-14%. Health and supplements: 12-18%. Food and beverage: 12-18%. Fashion subscriptions: 15-25%. SaaS businesses target much lower numbers — under 5% monthly is healthy, under 2% is best-in-class. The absolute number matters less than the trend: are newer cohorts churning faster or slower than older ones?
How do I reduce customer churn?
The interventions that move customer churn, ranked by typical impact: (1) implement smart dunning to recover failed payments — fastest 30-60 day win, addresses 25-40% of total churn; (2) fix the first-purchase-to-second-purchase gap with post-purchase welcome flows; (3) deploy segment-aware winback campaigns matched to churn reason; (4) optimize subscription cancellation flows with reason-matched retention offers; (5) launch VIP and loyalty programs that compound retention over time. Most brands compound several of these for a 25-50% LTV lift over 12 months.
How is customer churn rate calculated for SaaS?
SaaS churn rate is typically calculated monthly: Monthly Churn Rate = (Customers Lost in Month / Customers at Start of Month) × 100. SaaS businesses also commonly track revenue churn (the percentage of recurring revenue lost) alongside customer churn (the percentage of customers lost) — the two diverge when high-revenue customers leave at different rates than low-revenue ones. Net revenue retention (which accounts for expansion revenue from existing customers) is the metric most often used at the executive level because it reveals whether the customer base is growing in value even when accounts churn.